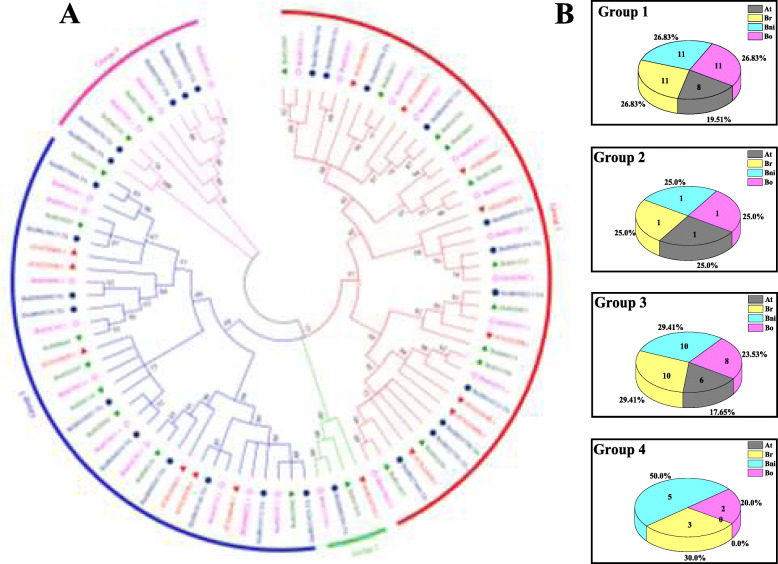
Fig. 2.
Phylogenetic analysis and distribution of PERK proteins from four plant species. a, Phylogenetic tree of B. rapa, B. nigra, B. oleracea, and A. thaliana. 89 PERKs from them are divided into four groups. The different-colored arcs indicate different groups of PERKs. The maximum likelihood (ML) tree was constructed by MEGA7 with the Bootstrap method (1000 replications) and the Jones, Taylor, and Thornton amino acid substitution (JTT) model. b, Number and percentage of PERK proteins across the four plant species within each subfamily. At, Arabidopsis thaliana; Br, Brassica rapa; Bni, Brassica nigra; Bo, Brassica oleracea

