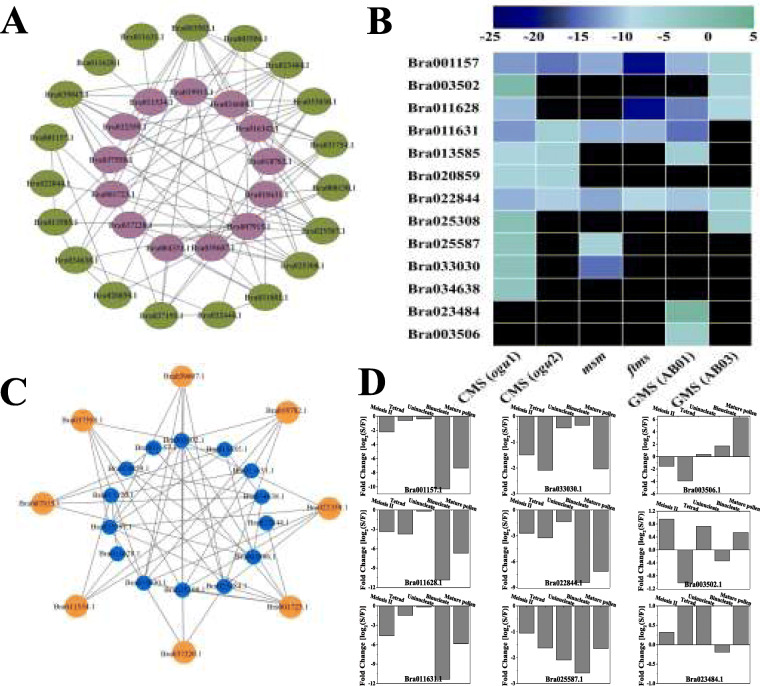
Fig. 7.
Co-expression, RNA-seq data and qRT-PCR analyses of BrPERK co-expressed genes. a. Co-expression network of BrPERK co-expressed genes was visualized; Nodes are connected by lines to show the interaction of that gene to other co-expressed gene; Reddish brown color indicates 13 down-regulated BrPERK genes and green color represent their co-expressed genes. b, Heat map analysis of BrPERK co-expressed genes in the six different male sterility lines; the color bar on the top represents fold change values.c. Co-expression network of BrPERK co-expressed genes; Orange color indicates 8 down-regulated BrPERK genes and blue color represent their co-expressed genes. d, qRT-PCR analysis of down-regulated BrPERK co-expressed genes in B. rapa ogu-CMS plants (Wucai)

