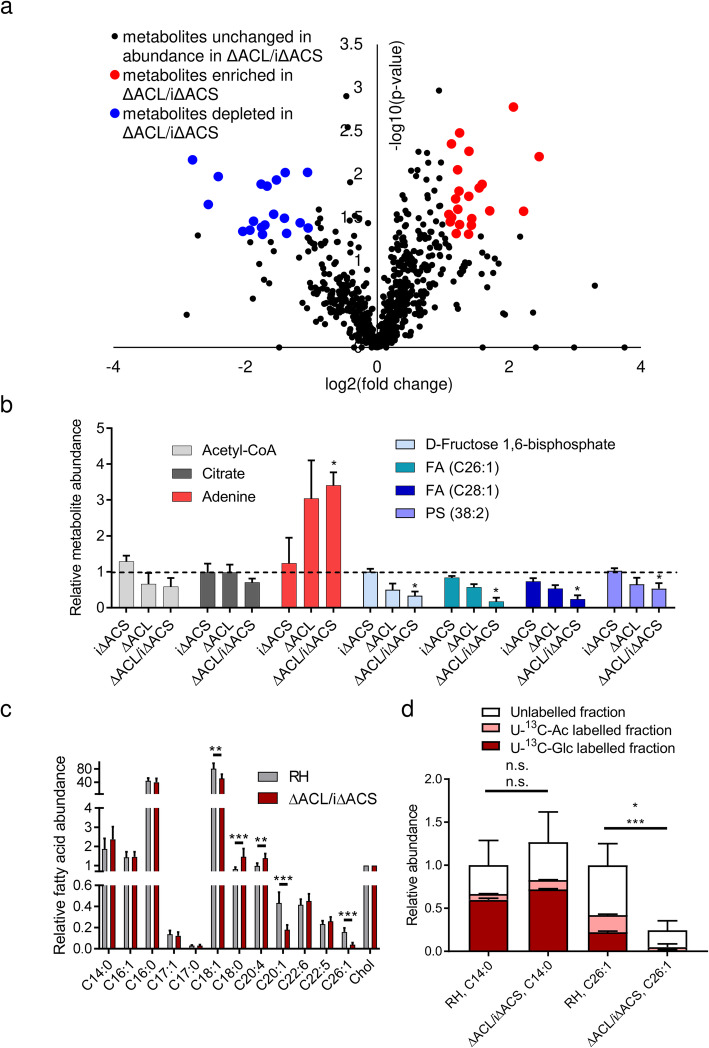
Fig. 3.
Loss of ACS and ACL causes changes in the T. gondii metabolome including a halt in FA elongation. a Volcano plot highlighting changes in metabolite levels of ΔACL/iΔACS compared to RH parasites. Unchanged metabolites are displayed in black, while significantly increased or decreased metabolites (≥ 2-fold change, p < 0.05) in ΔACL/iΔACS are displayed in red and blue, respectively. Statistically significant differences were assessed using a t-test comparing triplicates of ΔACL/iΔACS parasites to triplicates of RH in the absence of Shield-1. b Relative abundance of selected metabolites compared to levels in RH-Shield-1 (dashed line), which are not significantly altered (acetyl-CoA, citrate), significantly decreased (d-fructose 1,6 bisphosphate, FAs C26:1 and C28:1, phosphatidylserine—PS38:2) or significantly increased (adenine) upon loss of ACS and ACL (ΔACL/iΔACS). Error bars represent the standard deviation between replicates (n = 3). Statistical significance was assessed using a t-test and is indicated (*p < 0.05). c GC-MS measurement of FA abundances normalised to cholesterol levels. Error bars represent the standard deviation between replicates (n = 6). Statistical significance was assessed by a t-test and is indicated (**p < 0.005; ***p < 0.0001). d Relative abundance and 13C-labelling in myristate (C14:0) and FA C26:1, following incubation in medium containing U-13C-glucose or U-13C-acetate for 16 h during simultaneous ACS depletion. Error bars represent the standard deviation between replicates. Top error bars represent the standard variation in abundance, and lower error bars represent the standard deviation in labelling between replicates (n = 6 for abundance measurement, n = 3 for labelling analysis). Statistical significance for abundances as indicated in c. Statistical significance was tested using a t-test. Differences in C14:0 labelling between RH ΔACL/iΔACS and are non-significant (n.s.). Statistically significant differences in U-13C-acetate (p < 0.05) and U-13C-glucose-labelling of C26:1 between RH and ΔACL/iΔACS are indicated (*p < 0.05; ***p < 0.0001), respectively. ACL, ATP citrate lyase; ACS, acetyl-CoA synthetase; FA, fatty acid; GC-MS, gas chromatography-mass spectrometry; Glc, glucose; Ac, acetate

