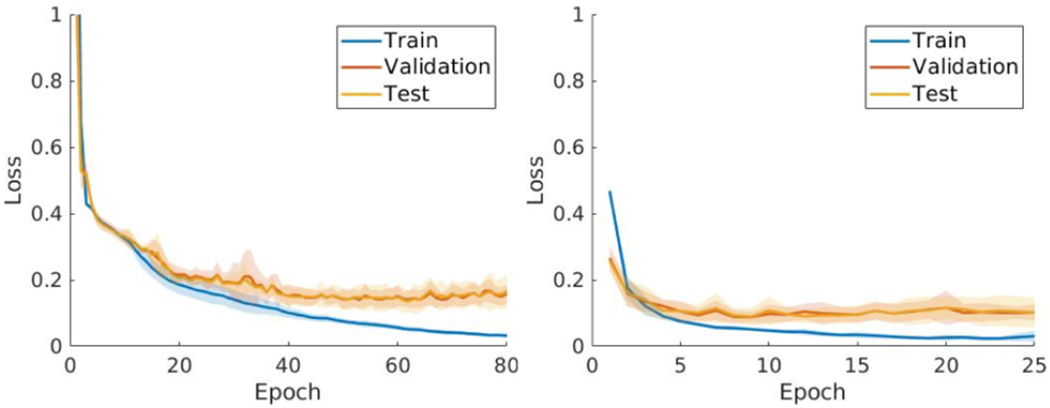
Fig. 4.

Average loss after 5-fold cross validation along the training, validation and testing epochs for standard spherica U-Net (left) and our method (right). The curves represent the average of 5-fold experiments. The shaded regions represent the standard deviations at each epoch.
