
Figure 3.
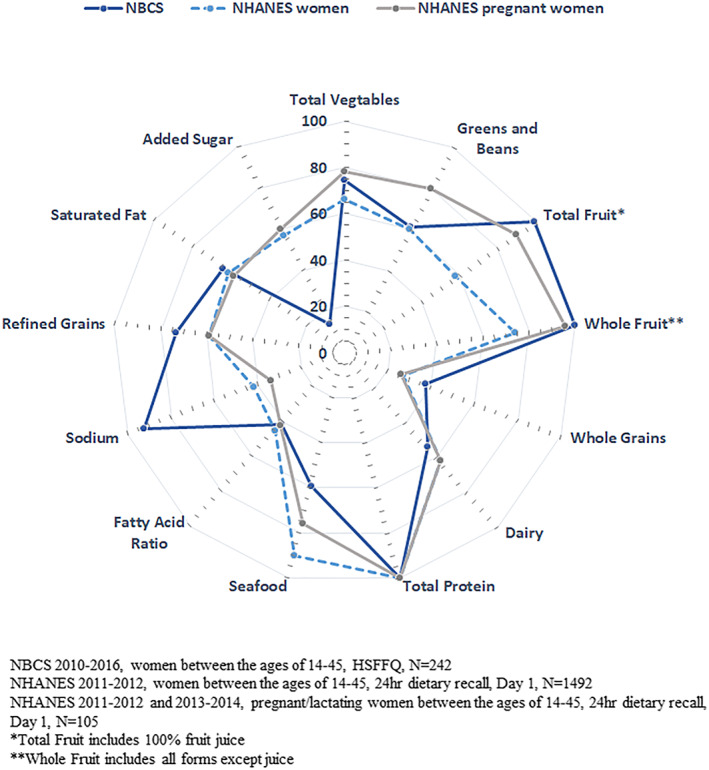
Radar plot of Healthy Eating Index‐2015 individual component scores for Navajo Birth Cohort Study (NBCS) and National Health and Nutrition Examination Survey (NHANES) groups. Each component point illustrates the percentage of total points received