
Figure 2.
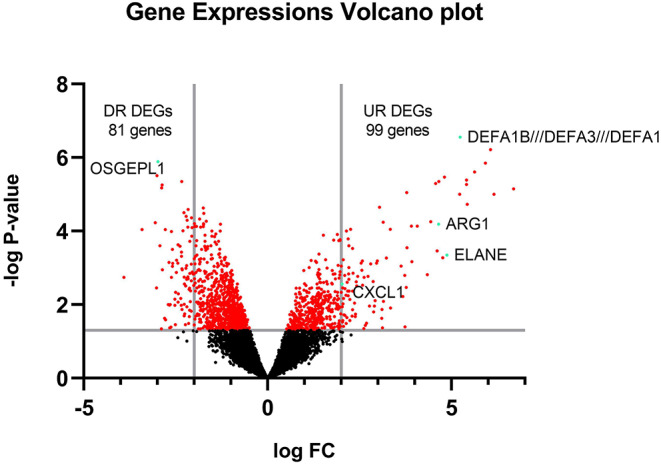
Volcano plot of all gene expressions. The y-axis is separated by a line on -log P = 1.301 showing the significance of expression area and the x-axis is separated by 2 lines on logFC = 2 and−2 showing DEGs.
Official websites use .gov
A
.gov website belongs to an official
government organization in the United States.
Secure .gov websites use HTTPS
A lock (
) or https:// means you've safely
connected to the .gov website. Share sensitive
information only on official, secure websites.
Volcano plot of all gene expressions. The y-axis is separated by a line on -log P = 1.301 showing the significance of expression area and the x-axis is separated by 2 lines on logFC = 2 and−2 showing DEGs.