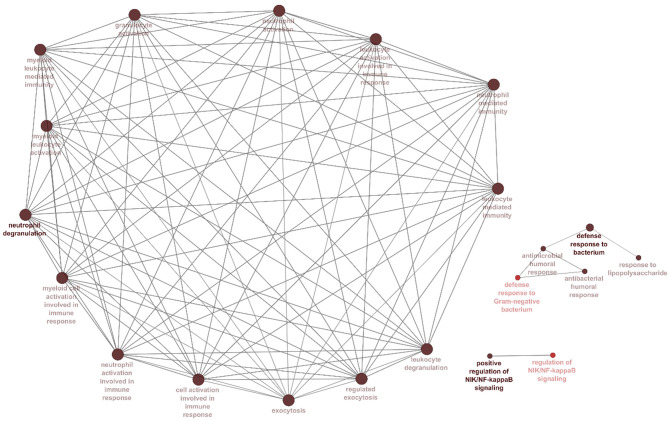
Figure 5.
Processes and pathways identified within the hubs and turquoise module. Gene ontology and pathway analysis were performed using significant genes across all datasets. Node size corresponds to the number of associated genes, and node color reflects the statistical significance. The darker pathway nodes, which are more statistically significant, are illustrated with a gradient from red (p-value 0.05–0.005) to black (p < 0.0005).

