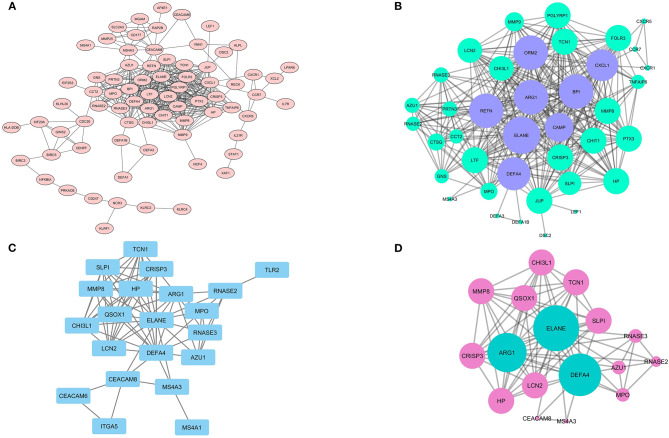
Figure 6.
The PPI network of DEGs and analyzed clusters. In the (A) network, the possible association between the product of each DEGs is shown with the confidence score ≥ 0.7 and (B) network illustrates the likely network between the members of the analyzed cluster by MCODE. (C) the network also shows the probable network between Hub genes and network (D) prepares a complete association between claustral expression among Hubs.

