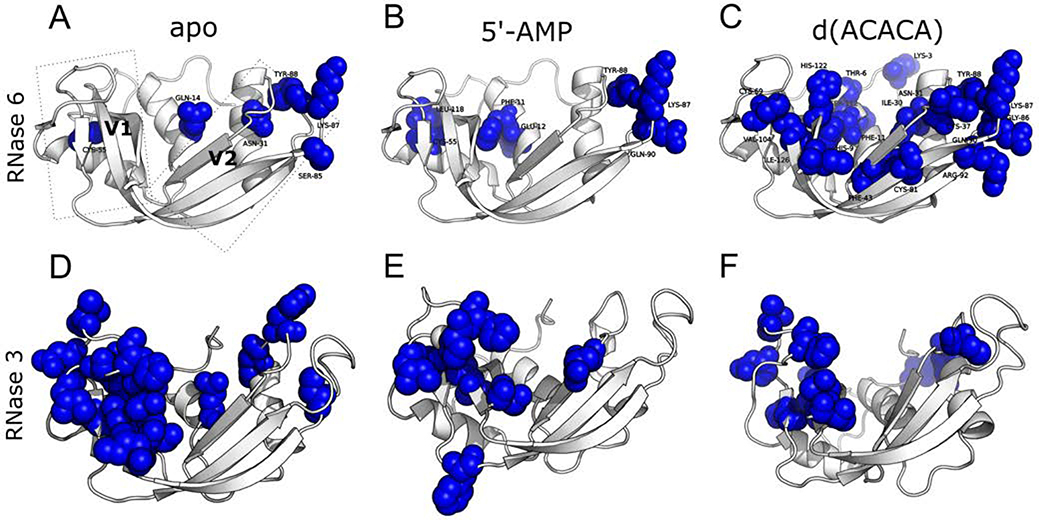
Figure 4.
Millisecond timescale conformational exchange experienced by RNase 6 and RNase 3 in the free and ligand-bound states. 15N-CPMG relaxation dispersion experiments were performed on the apo (A, D), 5’-AMP- (B, E) and d(ACACA)-bound (C, F) states of 15N-labeled RNase 6 and RNase 3. Residues identified as undergoing conformational exchange on the millisecond timescale (ΔR2,eff (1/τcp) > 1.5 s−1, as previously described44) are depicted using a space-filling representation. Representative relaxation dispersion curves for residues in the apo and ligand-bound states are shown in Figure S5.

