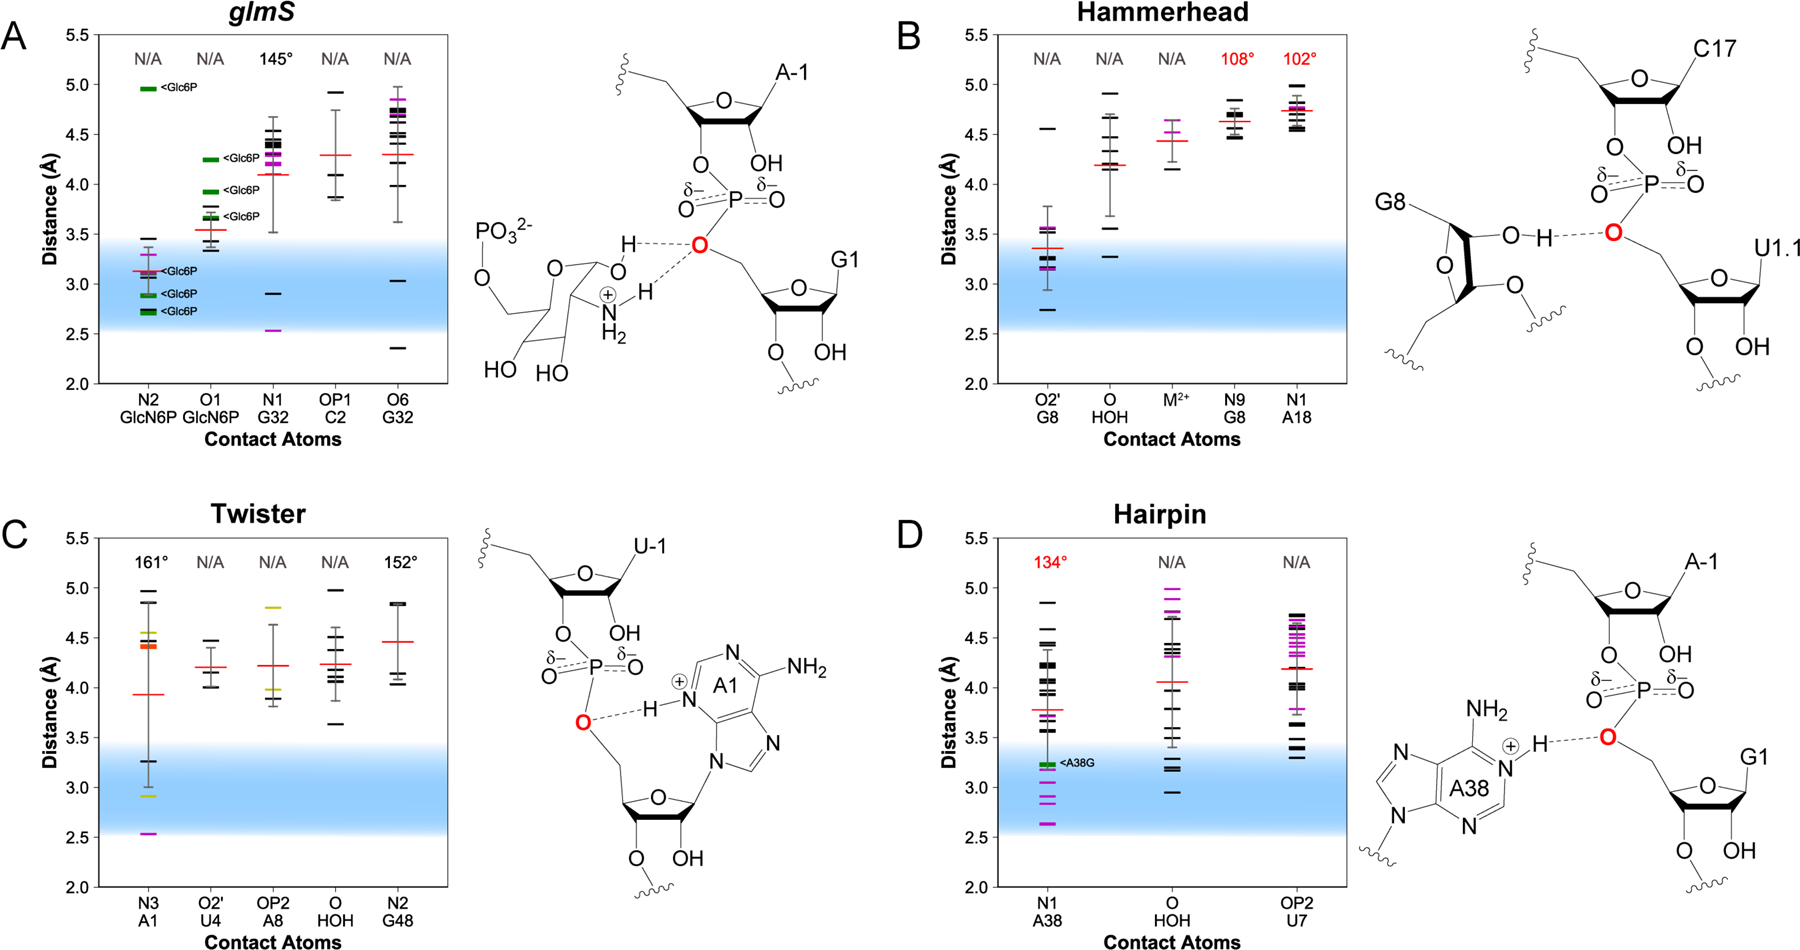
Figure 6. Contacts for δ: Neutralization of charge on the O5′.

Distances between the O5′ and nearby atoms are shown for the (A) glmS, (B) hammerhead, (C) twister, and (D) hairpin ribozymes. Distances observed in each crystal structure are shown as horizontal black (WT), green (variant), purple (intermediate-mimic), yellow (simulation-averaged), or orange (not catalytically relevant) lines; average distances are shown as horizontal red lines; standard deviation is shown as a gray vertical line. Illustrations to the right of each plot visualize contacts within 4 Å of the O5′.
