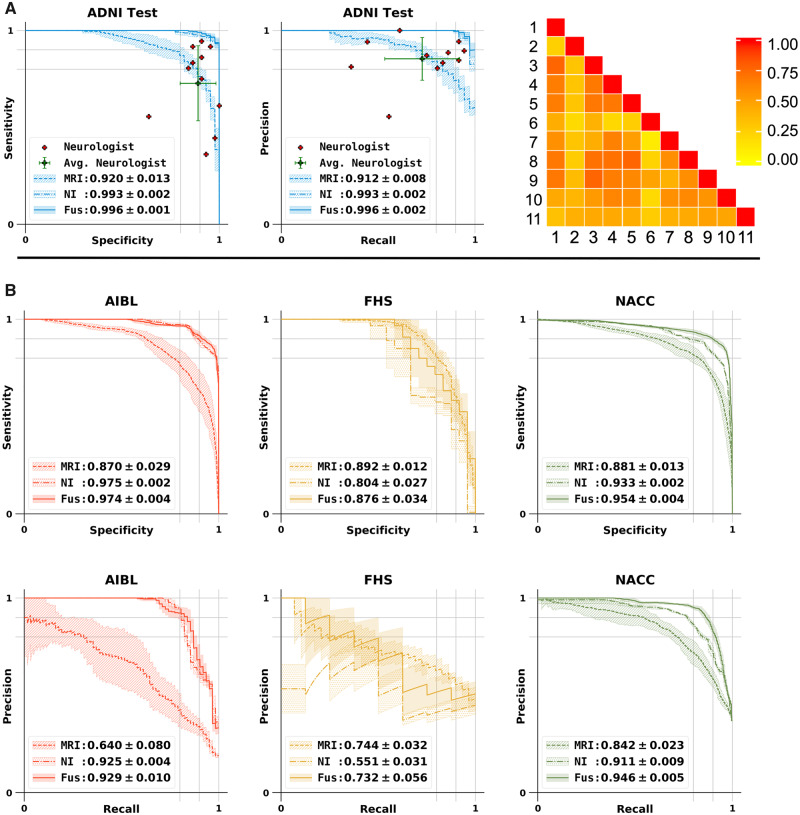
Figure 5.
Performance of the MLP model for Alzheimer’s disease classification and model comparison with neurologists. (A) Sensitivity-specificity and precision-recall curves showing the sensitivity, the true positive rate, versus specificity, the true negative rate, calculated on the ADNI test set. Individual neurologist performance is indicated by the red plus symbol and averaged neurologist performance along with the error bars is indicated by the green plus symbol on both the sensitivity-specificity and precision-recall curves on the ADNI test data. Visual description of pairwise Cohen’s kappa (κ), which denotes the inter-operator agreement between all the 11 neurologists is also shown. (B) Sensitivity-specificity and PR curves calculated on the AIBL, FHS and NACC datasets, respectively. For all cases, model A indicates the performance of the MLP model that used MRI data as the sole input, model B is the MLP model with non-imaging features as input and model C indicates the MLP model that used MRI data along with age, gender and MMSE values as the inputs for binary classification.

