Figure 1.
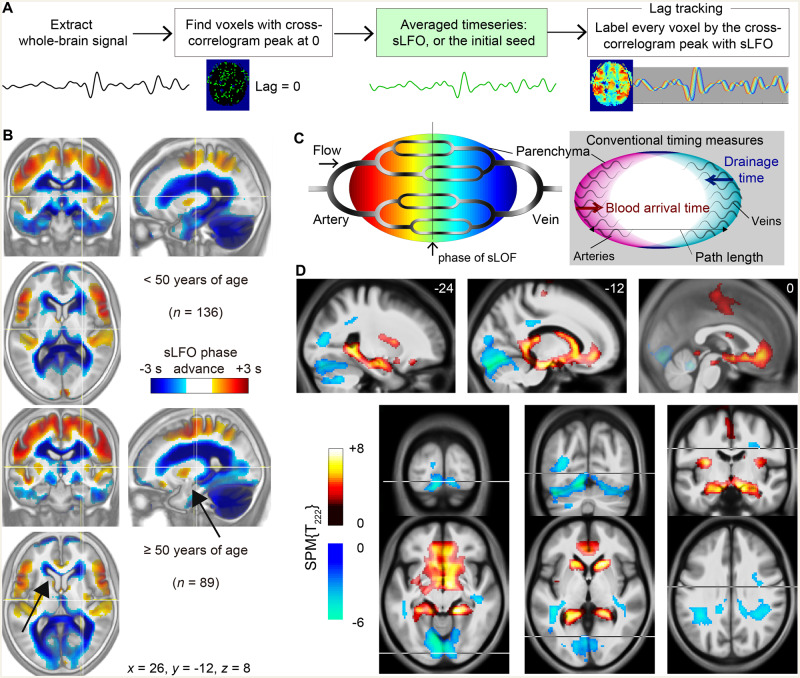
Age-related changes in the perfusion lag map. (A) Steps in the BOLD perfusion lag-mapping procedure. Once the sLFO was determined by averaging the time series from voxels with lag = 0, it was used as the reference signal to measure the time shift for each brain voxel by the cross-correlogram peak. This final part was performed by creating a 3D time × space (voxel) × time-shift matrix and finding the maxima along the third dimension. (B) Average lag maps overlaid on the average anatomical T1 images (inverted contrast) for the young and the elderly group. Negative values (cool colours) indicate late phases relative to the global sLFO representing the centre of the vascular tree. Regions with age-related phase shifts are indicated by arrows. (C) Schematic of the present analytical model of the BOLD lag structure. Greyscale shadings in the vascular tree represent the intrinsic source of slow signal fluctuation. The right panel illustrates the relationship with conventional temporal metrics based on different reference points. (D) Regions presenting linear correlations with age. Positive shifts are indicated by warm colours. Overlaid are t-score maps from the voxel-wise multiple regression with a degree of freedom of 222 (n = 225; age and sex as independent variables; voxel-wise false discovery rate-corrected P < 0.05). These clusters were used as the deep/superficial venous regions-of-interest in the following analyses. Results with a more stringent threshold are presented in Supplementary Fig. 1.

