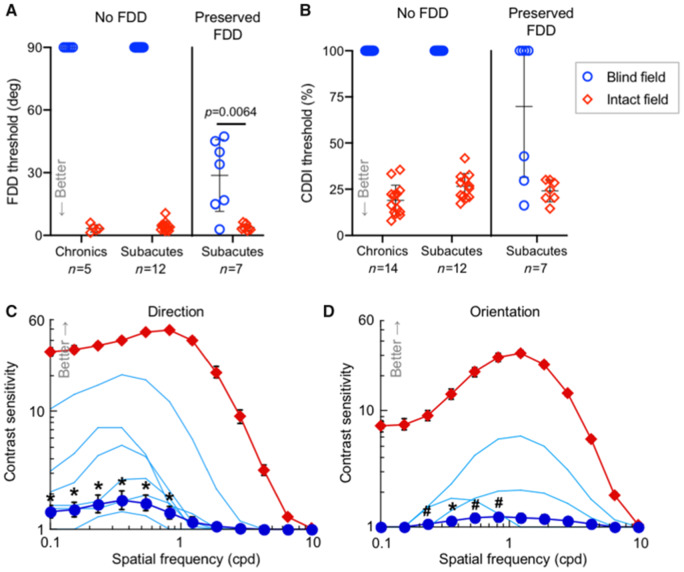
Figure 4.
Preserved visual discrimination abilities in subacute but not chronic cortically-blind fields. (A) Plot of individual baseline FDD thresholds at blind-field training locations and corresponding, intact-field locations in patients with chronic and subacute cortically-induced blindness. Bars indicate means ± SD. Baseline FDD was unmeasurable in all chronics and two-thirds of subacutes, but measurable in one-third of subacutes. Patient CB15 is included in both subacute categories because of this hemianope’s ability to discriminate FDD in one blind-field quadrant but not the other, illustrating heterogeneity of perception across cortically-blind fields. As a group, subacutes’ baseline FDD thresholds were better than chronics’ [one-sample t-test versus mean of 90°, t(18) = 3.08, P = 0.0064]. However, subacutes with preserved FDD had worse thresholds than in their own intact hemifields [paired t-test, t(6) = 4.09, P = 0.0064]. (B) Plot of baseline CDDI at blind- and corresponding intact-field locations in patients with chronic and subacute cortically-induced blindness, stratified by preservation of blind-field FDD. Three subacutes with preserved blind-field FDD had measurable CDDI thresholds, a phenomenon never observed in chronics. (C) Baseline contrast sensitivity functions for direction discrimination in the blind and intact fields of subacutes (datapoints = mean ± SEM); light blue lines denote contrast sensitivity functions of participants with preserved blind-field sensitivity (significant in n = 5, P < 0.005; in the sixth subject, P = 0.16, see ‘Materials and methods’ section for bootstrap analysis). Group t-tests were performed at each spatial frequency: *P < 0.05, #P < 0.10. There were significant effects for peak contrast sensitivity [t(14) = 2.38, P = 0.016] and total area under the contrast sensitivity function [t(14) = 2.10, P = 0.027] (D) Baseline contrast sensitivity functions for orientation discrimination in subacutes. Labelling conventions as in C. Statistics for peak contrast sensitivity and area under the contrast sensitivity function: t(13) = 1.5, P = 0.079 and t(13) = 1.62, P = 0.065, respectively.

