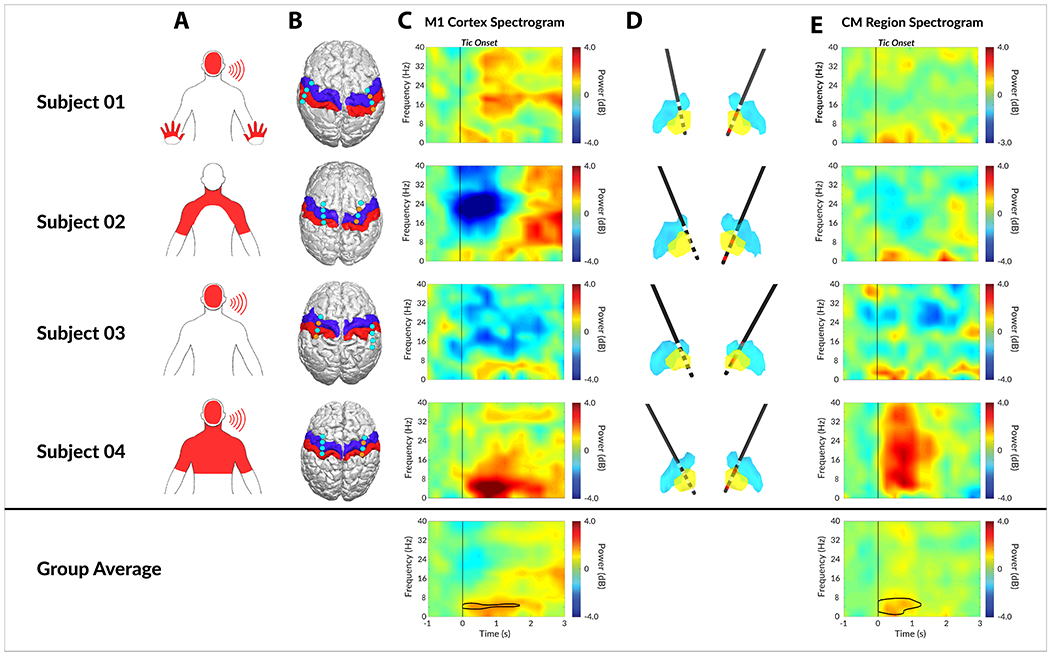
Figure 3. Neural correlates of tic generation in M1 cortex and CM thalamic nucleus.

A) Dominant tic locations as marked on pictograms. B) The localization of bilateral subdural strips from all 4 patients. The blue and red overlay indicate primary motor (M1) cortex and primary somatosensory (S1) cortex respectively. The cyan dots indicate the center of each of the 4 contacts on subdural strips, whereas the orange dots represent bipolar recording electrodes. C) The individual tic onset spectrogram recorded from M1 cortex. D) The localized depth electrodes with digitized atlas. Yellow and blue nuclei represent CM thalamic nucleus and Vim thalamic nucleus respectively. Active contacts for recording are marked in red. E) The individual tic onset spectrogram recorded from CM thalamic nucleus. Area within black contour is statistically significant (FDR < 0.01) in group analysis.
