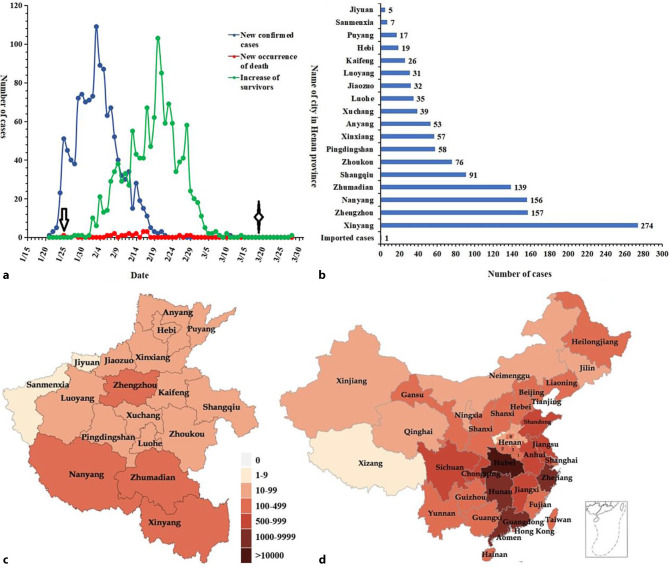
Fig. 1.
Time and geographic distributions of COVID-19 cases in Henan province. a Distribution of COVID-19 cases with time, the arrow denotes the start time of the bundle of strategies, the star denotes the day on which the preventive level was adjusted lower. b Distribution of COVID-19 cases in different cities in Henan. c Geographic distribution of COVID-19 in Henan. d The neighboring relationship between Henan and Hubei and the epidemic in China. The numbers 1, 2, 3, 4 represent the cities of Xinyang, Zhumadian, Nanyang and Zhengzhou, respectively

