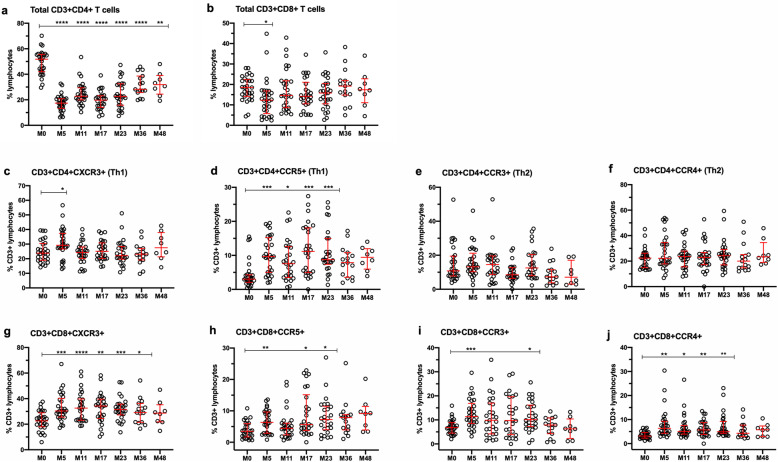
Fig. 2.
Changes in CD4+ and CD8+ T cells expressing chemokine receptors in whole blood. a Total CD3+CD4+ T lymphocytes. b Total CD3+ CD8+ T cells. c and d Show CD3+CD4+ T cells expressing CXCR3 and CCR5, respectively, which are enriched in Th1 cells. e and f Show CD3+CD4+ T cells expressing CCR3 and CCR4, respectively, which are enriched in Th2 cells. g–j Show CD3+CD8+ T cells that express CXCR3, CCR5, CCR3, and CCR4, respectively. Data represent median/IQR values for all patients at each timepoint; open circles indicate data points for each individual patient. p values indicate significant changes from baseline (M0) values as follows: ****p ≤ 0.0001, ***p ≤ 0.001, **p ≤ 0.01, *p ≤ 0.05; mixed effects ANOVA with Tukey’s corrections for multiple comparisons

