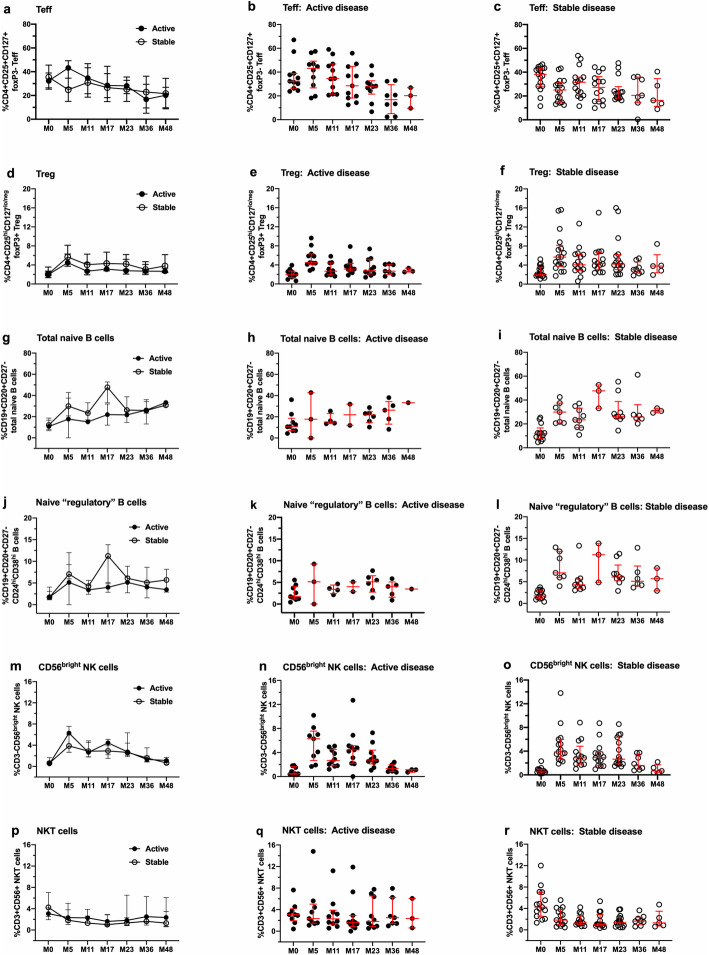
Fig. 6.
Lack of significant differences in selected lymphocyte subsets stratified for patients with active and stable disease activity during the 48-month study period. Each row represents data from one lymphocyte subset, with the left panels in each row illustrating between-subjects analyses, followed by within-subjects analyses for patients with active (middle panels) and stable (right panels) disease activity. a–c Changes in CD4+CD25+CD127+foxP3- Teff. d–f Changes in CD4+CD25hiCD127lo/neg foxP3+ Tregs. g–i Changes in CD19+CD20+CD27- total naïve B cells. j–l Changes in CD19+CD20+CD27-CD24hi CD38hi B cells. m–o Changes in CD3-CD56bright NK cells. p–r Changes in CD3+CD56+ NKT cells. Data represent median/IQR; closed symbols indicate patients with active disease, and open symbols indicate patients with stable disease. Data were subjected to between- and within-subject analyses using a linear mixed effects model for repeated measures

