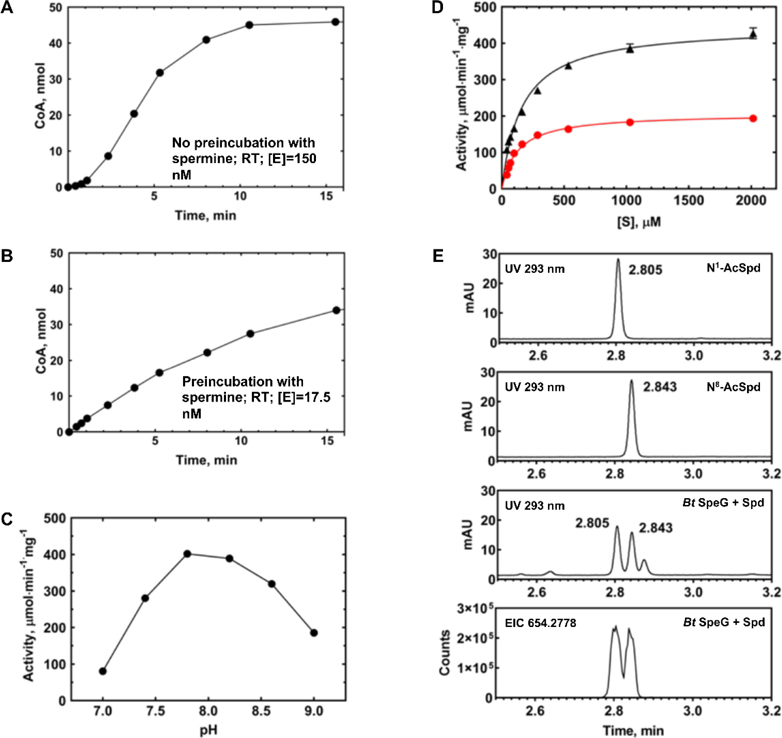
Figure 5. Kinetic characterization of BtSpeG.
A, Reaction time course at RT, no preincubation of enzyme with spermine. BtSpeG enzyme concentration was 150 nM and the reaction contained 70 mM Bicine pH 7.8, 20 mM NaCl, 4 mM spermine, and 1 mM AcCoA. B, Reaction time course at RT, with preincubation of enzyme with spermine. BtSpeG enzyme concentration was 17.5 nM. C, Activity of BtSpeG pre-incubated with spermine as a function of pH of Bicine buffer. Each reaction contained 70 mM Bicine buffer at different pH values, 20 mM NaCl, 4 mM spermine, and 1 mM AcCoA and reactions were performed for 5 min at 37°C. Enzyme was preincubated with spermine. D, Substrate saturation curves of BtSpeG toward spermine (black triangles) and spermidine (red circles). Enzyme was preincubated with either spermine or spermidine depending upon which polyamine was being assayed. 4 nM enzyme was used for spermine saturation curves and 8.5 nM enzyme was used for spermidine saturation curves. All reactions were performed in duplicate and the average and standard deviation of at least two biological replicates are shown. E, Identification of products of enzymatic acetylation of spermidine by LC/MS. Products of the 5 min reaction containing 11.8 nM BtSpeG, 4 mM spermidine, and 1 mM AcCoA at 22 deg C (Bt SpeG +spd) are compared to 200 uM solutions of N1 and N8 acetylspermidine standards. The bottom trace is the ion chromatogram for the fully dansylated acetylspermidine extracted using a 20 ppm window.

