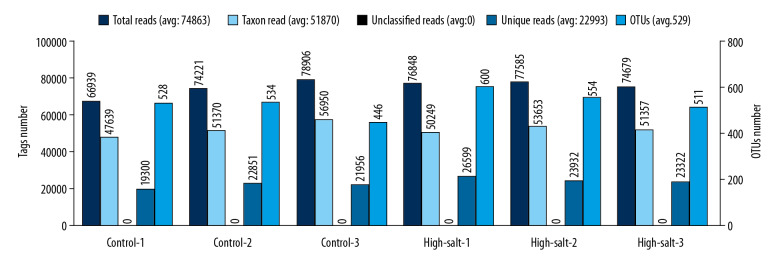
Figure 1.
Operational taxonomic unit (OTU) clustering and annotation statistics for the individual rats in the study group and the control group. Microbial DNA was extracted from the rat fecal pellets after a four-week scheduled intragastric administration of a high-salt solution (the study group) or water (the control group). The X-axis, individual rats of the control and high-salt group. The Y-axis (left), reads number. The Y-axis (right), the OTU number.

