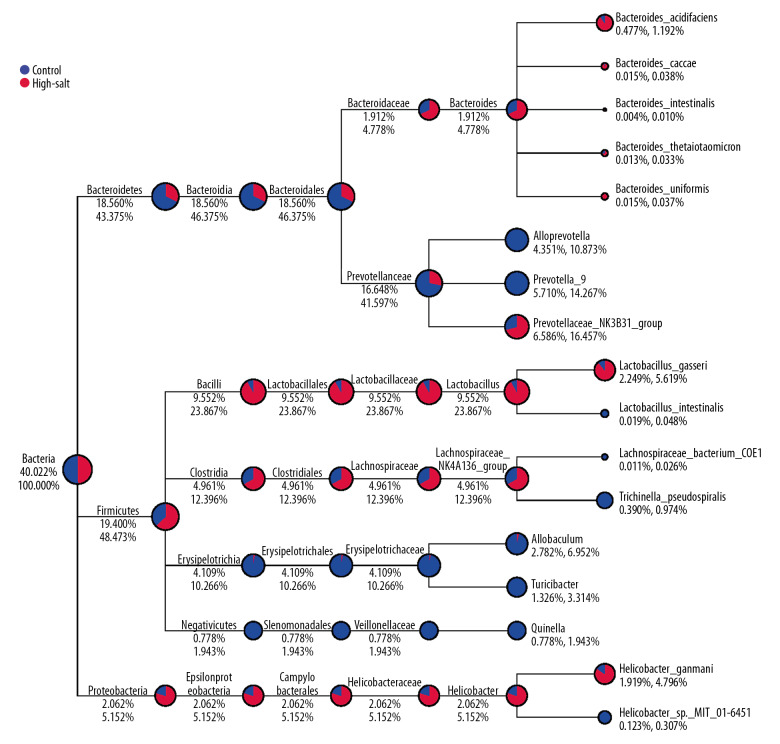
Figure 2.
The taxa_tree of the specific species for rats in the study group and the control group. The different colors in the circle represented the different groups. The fan-shaped size indicates the relative abundance ratio in each classification of the two groups. The number below the category name indicates the percentage of average relative abundance in this classification. The number on the left represents the percentage of all species. The number on the left represents the percentage of the selected species.

