
Fig. 1. Engineering and characterization of SpCas9 variants capable of targeting NGN PAMs.
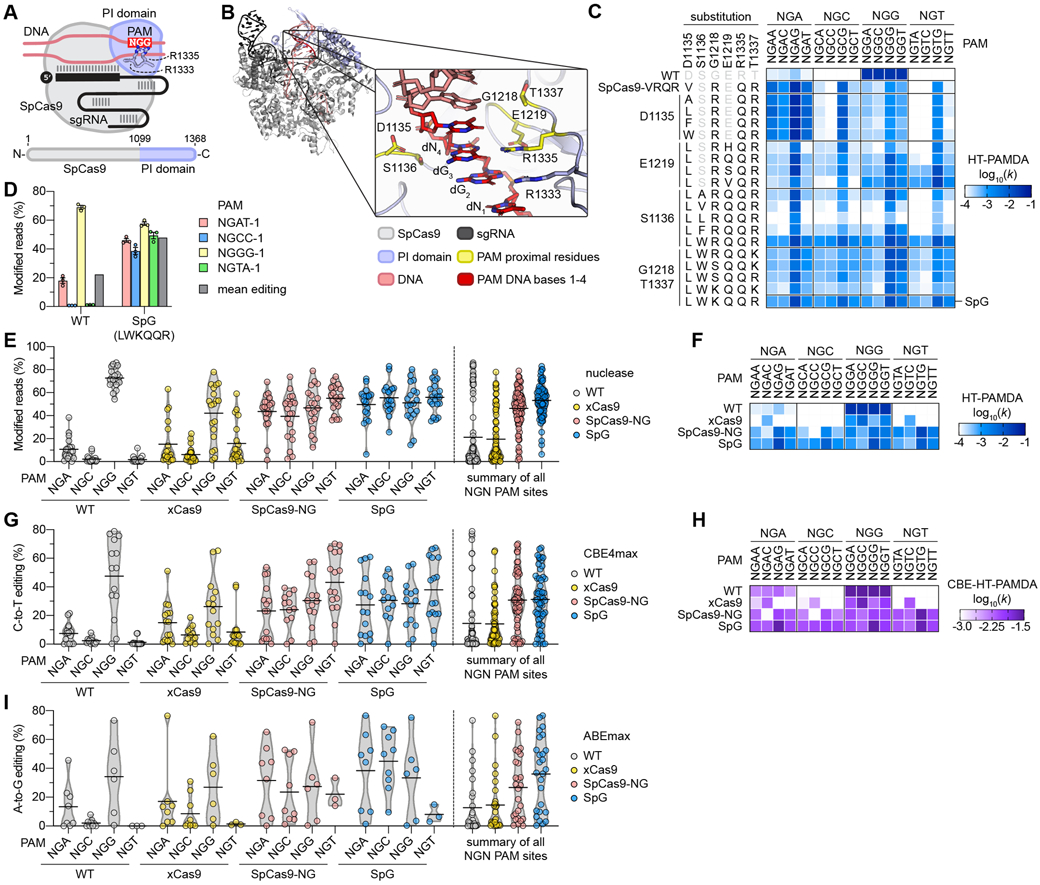
(A) Schematic of SpCas9, highlighting the PAM-interacting (PI) domain along with R1333 and R1335 that make base-specific contacts to the guanines of the NGG PAM. (B) Rendering of a crystal structure of SpCas9 with amino acid side chains proximal to the second guanine of the NGG PAM shown in yellow. In the zoomed image the non-target strand (NTS) is hidden for clarity. Image generated from PDB ID 4UN3(20). (C) HT-PAMDA characterization of wild-type (WT) SpCas9 and engineered variants to illustrate their NGNN PAM preferences. The log10 rate constants (k) are the mean of at least two replicates against two distinct spacer sequences (see also Figs. S2A-C, E). (D) Modification of endogenous sites in human cells bearing a canonical and noncanonical PAMs with WT SpCas9 and SpG. Editing assessed by targeted sequencing; mean, s.e.m., and individual data points shown for n = 3. (E) Mean nuclease activity plots for WT, xCas9(23), SpCas9-NG(22), and SpG on 78 sites with NGN PAMs in human cells. The black line represents the mean of 19-20 sites for each PAM class (see also Fig. S5A), and the grey outline is a violin plot. (F) HT-PAMDA characterization of WT, xCas9, SpCas9-NG, and SpG to illustrate their NGNN PAM preferences. The log10 rate constants (k) are the mean of at least two replicates against two distinct spacer sequences. (G) Mean C-to-T editing plots for WT, xCas9, SpCas9-NG, and SpG cytosine base editors (CBEs) on 57 cytosines within the editing windows (positions 3 through 9) of 20 target sites harboring NGN PAMs in human cells. The black line represents the mean of 12-16 cytosines for each PAM class (see also Fig. S6A), and the grey outline is a violin plot. (H) CBE-HT-PAMDA data for WT, xCas9, SpCas9-NG, and SpG to illustrate their NGNN PAM preferences. The log10 rate constants (k) are single replicates against one spacer sequence (see also Figs. S6C, D). (I) Mean A-to-G editing plots for WT, xCas9, SpCas9-NG, and SpG adenine base editors (ABEs) on 24 adenines within the editing windows (positions 5 through 7) of 21 target sites harboring NGN PAMs in human cells. The black line represents the mean of 3-9 adenines for each PAM class (see also Fig. S7A), and the grey outline is a violin plot.