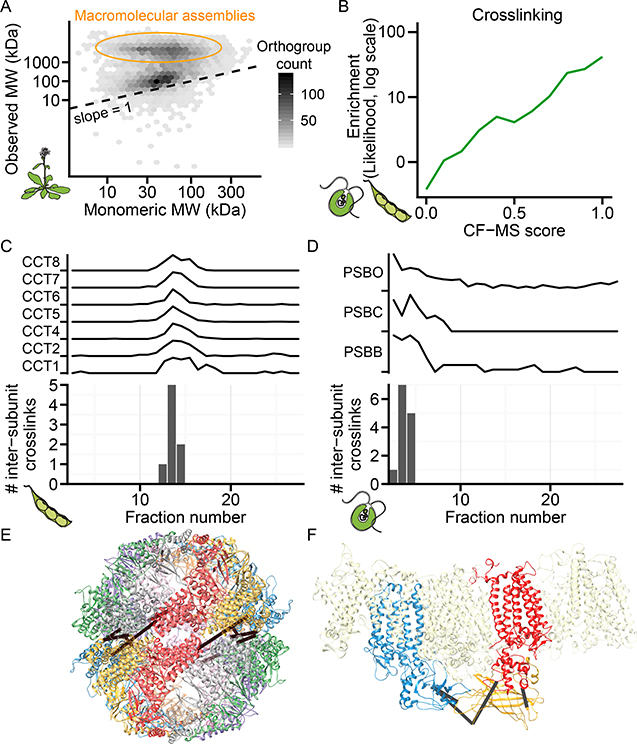
Figure 4. Protein Complexes Validated by Calibrated Molecular Mass Determination and Direct Chemical Cross-linking.
(A) Observed mass vs. predicted monomeric mass in a representative Arabidopsis size exclusion chromatography (SEC) fractionation. Shading reflects the number of orthogroups per hexagonal bin.
(B) Cross-linked proteins from soy and Chlamydomonas are more likely (green line, log-likelihood) to have high CF-MS scores compared to non-cross-linked observed proteins.
(C-D) Inter-subunit cross-links only appear in fractions where complex subunits co-elute. Elution profile and inter-subunit crosslinks for soy T-complex chaperonin (CCT) shown in (C) and Chlamydomonas Photosystem II (PSB) shown in (D)
(E-F) 3D homology models of complexes (see STAR methods) with observed inter-subunit cross-links (black lines). Soy CCT (E) is colored by subunit, and Chlamydomonas
Photosystem II (E) highlights PSBB, PSBC, and PSBO as blue, red, and yellow, respectively.

