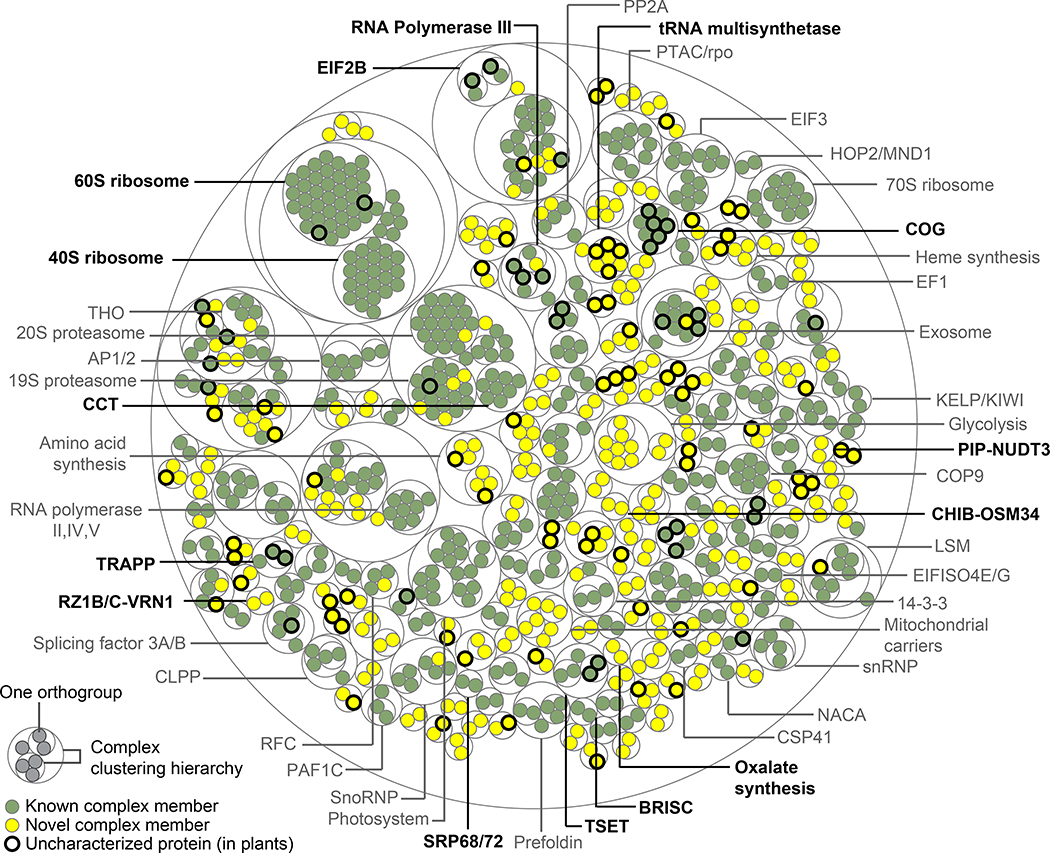
Figure 5. Overview of Evolutionarily Conserved Plant Protein Complexes. Also Figure S3.
Thin concentric circles show the clustering hierarchy of protein-protein interactions into complexes for each of four clustering thresholds. (Table S4 lists complexes and annotations.) Protein orthogroups (filled circles) are colored green for associations previously reported in any species or yellow for those first reported in this study. Bold outlines denote proteins uncharacterized in plants, defined as uncharacterized if all proteins in the orthogroup lack an Arabidopsis gene symbol and a Uniprot Function annotation. Bold complex labels are discussed in the text.

