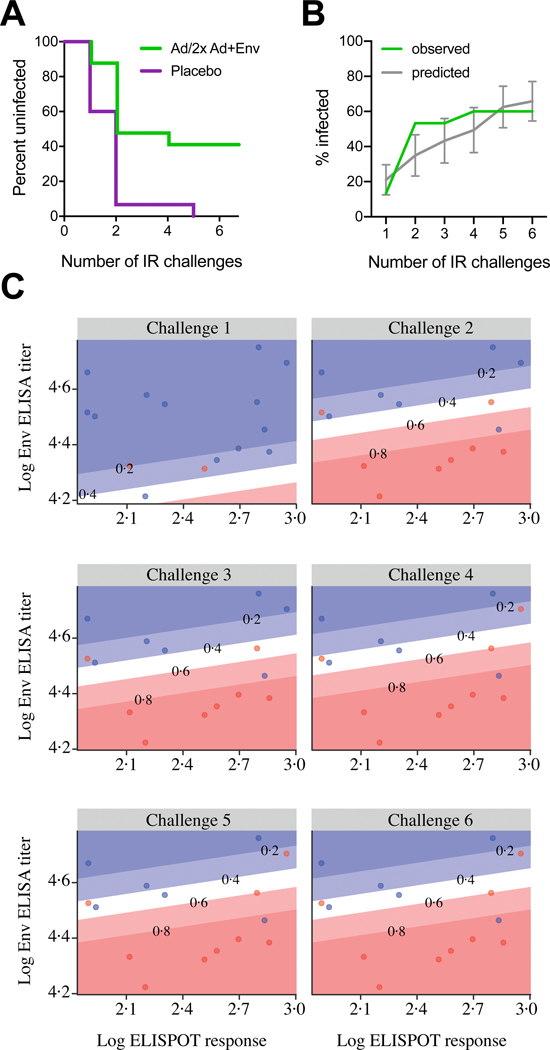
Figure 5: Protective efficacy in rhesus monkeys and correlates of risk reduction.
Six weekly intrarectal challenges were administered to rhesus monkeys at weeks 1, 2, 3, 4, 5 and 6. (A) Kaplan-Meier plot of the level of protection the short vaccine regimen offered to the 15 rhesus monkeys at risk per group, assessed one week after each challenge. No animals were censored. (B) Mean predicted infection frequency compared to observed infection frequency per time point (vaccine group only). Predictions are based on a model that was generated with historic data using peak immunogenicity Clade C ELISA and PTE Env ELISPOT data5. Error bars depict the 95% confidence interval. (C) Humoral and cellular immune responses measured by clade C ELISA and PTE Env ELISPOT at week 28, the week following each of six challenges (at weeks 54–59) of monkeys from the vaccine group. Blue dots represent uninfected monkeys per timepoint, and red dots indicate monkeys that were infected following each challenge. The diagonal lines display model-derived probabilities of infection, modeled on ELISA and ELISPOT responses.

