FIGURE 3.
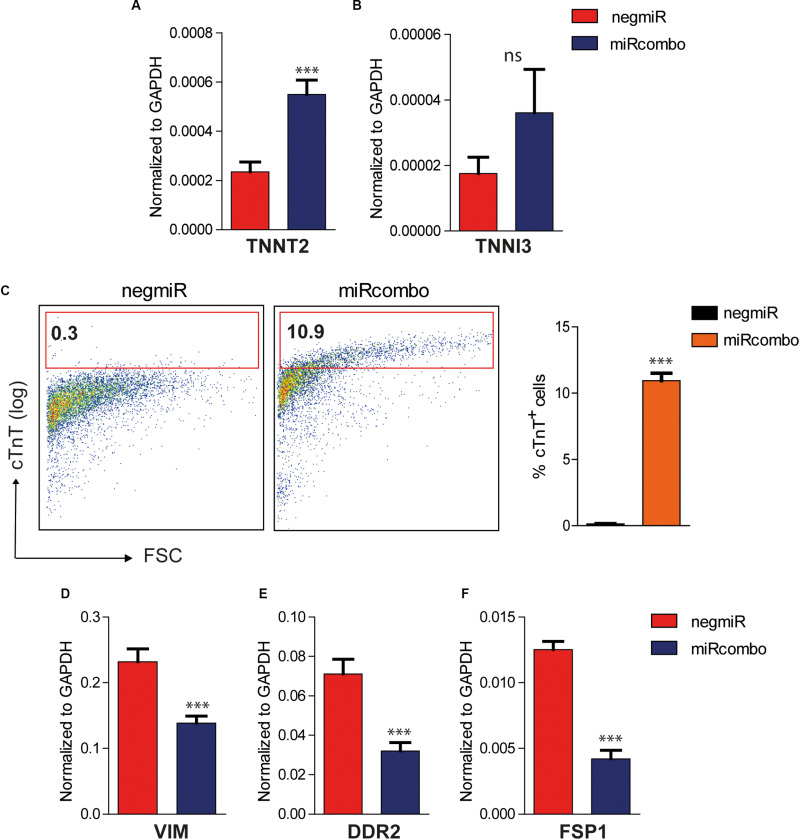
Induction of cardiomyocyte markers in miRcombo-transfected AHCFs. (A,B) Gene expression of cardiomyocyte markers TNNT2 and TNNI3 in AHCFs transfected with miRcombo (red) or negmiR (blue) evaluated by ddPCR. Data are representative of three independent experiments, each performed in triplicate. (C) Representative flow plots (left panel) and percentage (right panel) of cTnT positive cells in AHCFs transfected with miRcombo (n = 3) and negmiR (n = 3) 15 days after transfection. (D–F) Gene expression of fibroblastic markers VIM, DDR2, and FSP-1 in AHCFs transfected with miRcombo (red) or negmiR (blue) by ddPCR. Data are representative of three independent experiments, each performed in triplicate. Stated P-value is versus negmiR.

