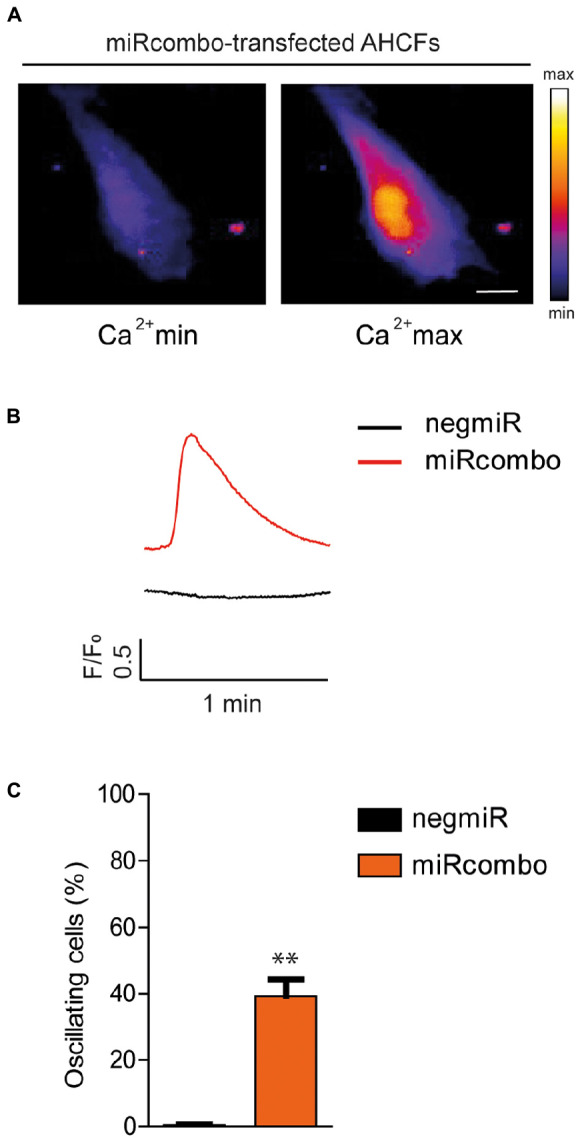
FIGURE 4.

miRcombo-transfected cells exhibit calcium transients. (A,B) Representative image, recorded with fluorescence microscopy (A) and trace (B) of Ca+2 oscillations in AHCFs transfected with miRcombo (n = 3) and negmiR (n = 3) after 30 days from transfection. Scale bar: 25 μm. (C) Bar graph reports the percentage of cells showing Ca+2 transients after 30 days from miRcombo and negmiR transfection. Stated P-value is versus negmiR.
