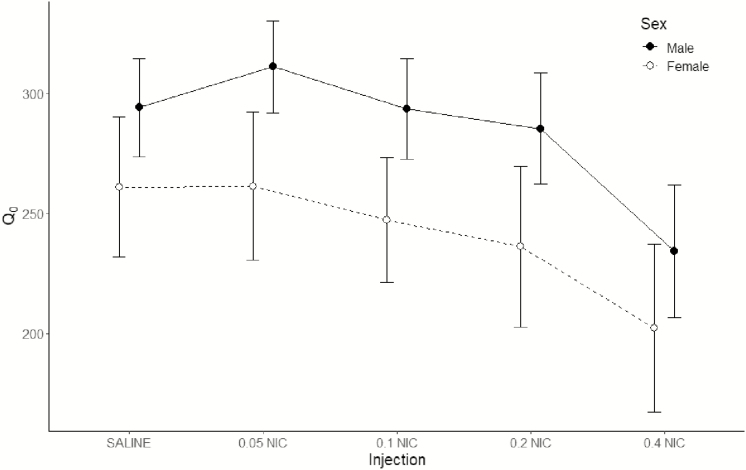
Figure 4.
Mean estimates (±1 SEM) of the ordinate intercept (Q0) generated by fits of the reinforcer demand model to the consumption data of individual rats, displayed as a function of nicotine dose. Data from the males is displayed using closed circles and a solid line; data from the females is displayed using open circles and a dashed line. Points are offset for improved readability.

