FIGURE 5.
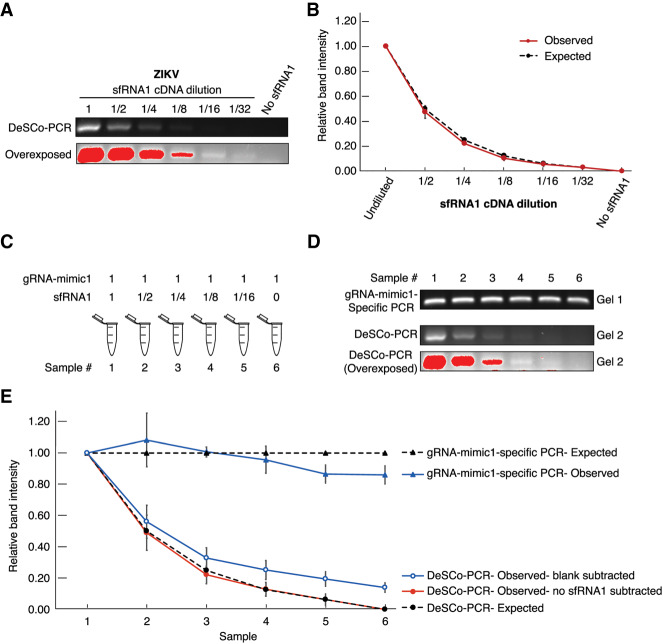
Measurement of relative amounts of in vitro transcribed ZIKV sfRNA1 by DeSCo-PCR. (A) DeSCo-PCR gel image. (B) Graph of relative amounts of ZIKV sfRNA1 as estimated by relative intensity measurements when only sfRNA1 was used for cDNA synthesis. 1, 1/2, 1/4, 1/8, 1/16, 1/32 denotes the sfRNA1 cDNA dilution, starting with 0.1 pmol of sfRNA. (C) Composition of RNA mix for reverse transcription containing dilutions of sfRNA1 in the presence of fixed amounts of gRNA-mimic1. 1, 1/2, 1/4, 1/8, 1/16 denotes the sfRNA1 dilution. (D) DeSCo-PCR gel image of dilutions in C. (E) Graph of relative RNA abundance as calculated by measuring the band intensities of PCR products. Gel1: gRNA-mimic1-specific PCR (both primers upstream of sfRNA1 sequence), Gel2: DeSCo-PCR. Red bands in the gel images denote saturated pixels from overexposing the gel.

