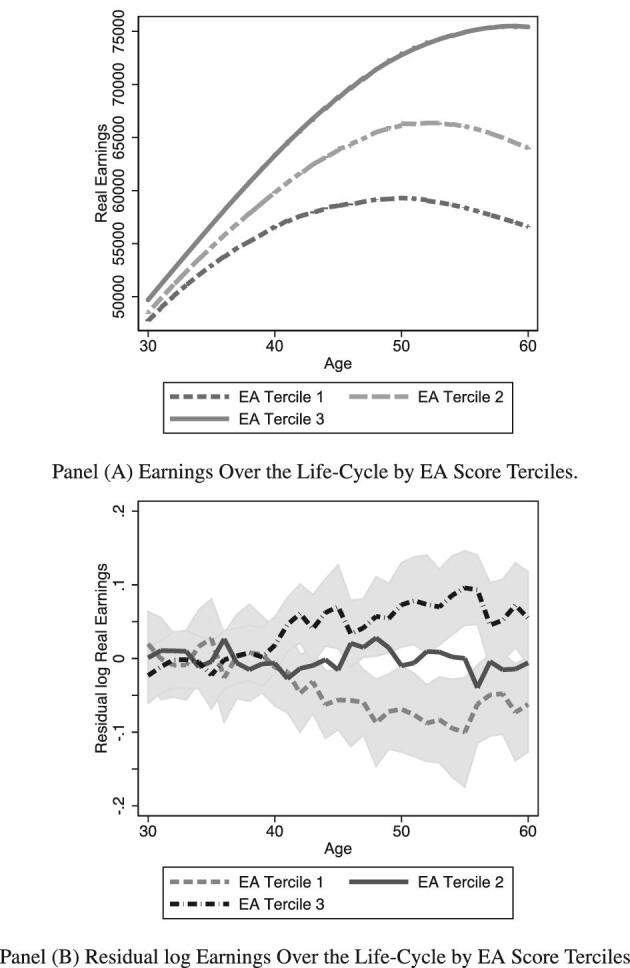
Figure 9.

The EA score and life-cycle income. Panel A plots the nonparametric (lowess) relationship between age and earnings levels by EA tercile. Panel B plots mean residual log earnings for each age by EA score tercile. Shaded areas depict 95% confidence intervals around these means for the top and bottom terciles.
