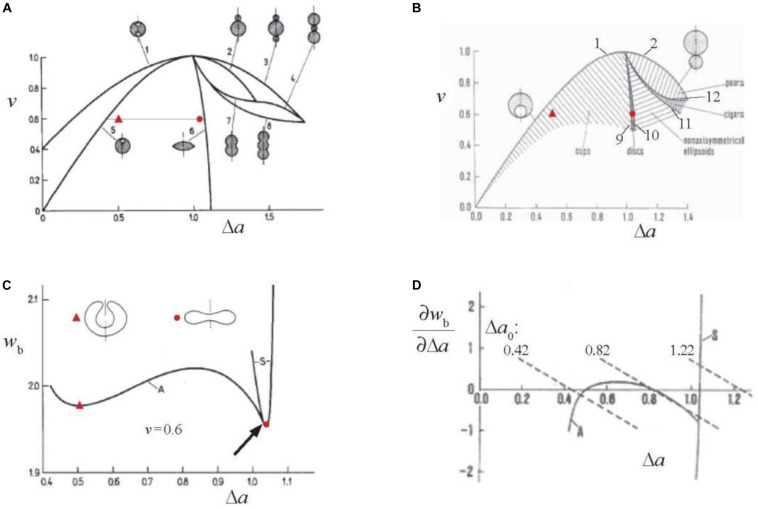
FIGURE 1.
Demonstration of basic features of the bilayer couple theories of vesicle shapes [(A–C) of “strict” and (D) of “generalized”]. (A) v(Δa) dependences of limiting shapes which correspond to the extreme values of v at a given value of Δa (lines 1 to 8) plotted in the v – Δa shape phase diagram (Svetina and Žekš, 1989). Examples of corresponding shape cross-section are also shown. The dotted horizontal line at v = 0.6 indicates the range of Δa values for which minimal membrane bending energy is presented in (C). Red point indicates the phase diagram location of a discocyte and red triangle of a characteristic stomatocyte. (B) Stable vesicle shapes in the central part of the v – Δa shape phase diagram. Lines 9–12 are symmetry breaking lines. Marked areas represent the parts of the shape phase diagram where there are no contacts between different regions of the membrane. The meaning of red points is the same as in (A). (C) Membrane bending energy wb (defined relative to the bending energy of the sphere which is 8πkc) calculated at v = 0.6 for the Δa values indicated by the dotted line in (A). Line S shows bending energy of disk shapes and line A of the cup shapes. The arrow indicates the point of the symmetry breaking of the disk shape as predicted by Svetina and Žekš (1989). Shown are also contours of cross-sections of a discocyte (red point) and a stomatocyte (red triangle) and it is indicated which are their Δa values. (D) The dependence of the partial derivatives of the bending energies S and A presented in (C) by the area difference Δa. The dotted lines present the right hand side of Eq. 4 for the indicated values of Δa0 and kr/kc = 3 (reprinted with permission from Svetina, 1998).

