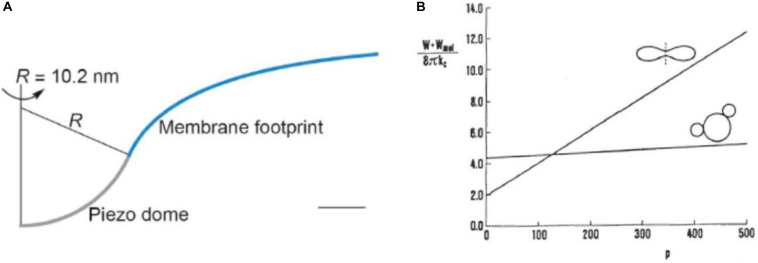
FIGURE 3.
Illustrations of effects of protein–membrane interaction. (A) The shape of the Piezo1 membrane footprint shown as the cross-section of the mid-bilayer surface and its intersection with the Piezo1 dome; scale bar: 4 nm (reprinted from Haselwandter and MacKinnon, 2018, held under CC-BY 4.0 license). (B) The sum of the membrane bending energy and the distributional free energy of mobile membrane inclusions calculated for the disk shape and for the shape that involves two buds for a cell with the reduced volume 0.6 in the dependence of the number of inclusions p (in some reduced units) (reprinted with permission from Svetina et al., 1996).

