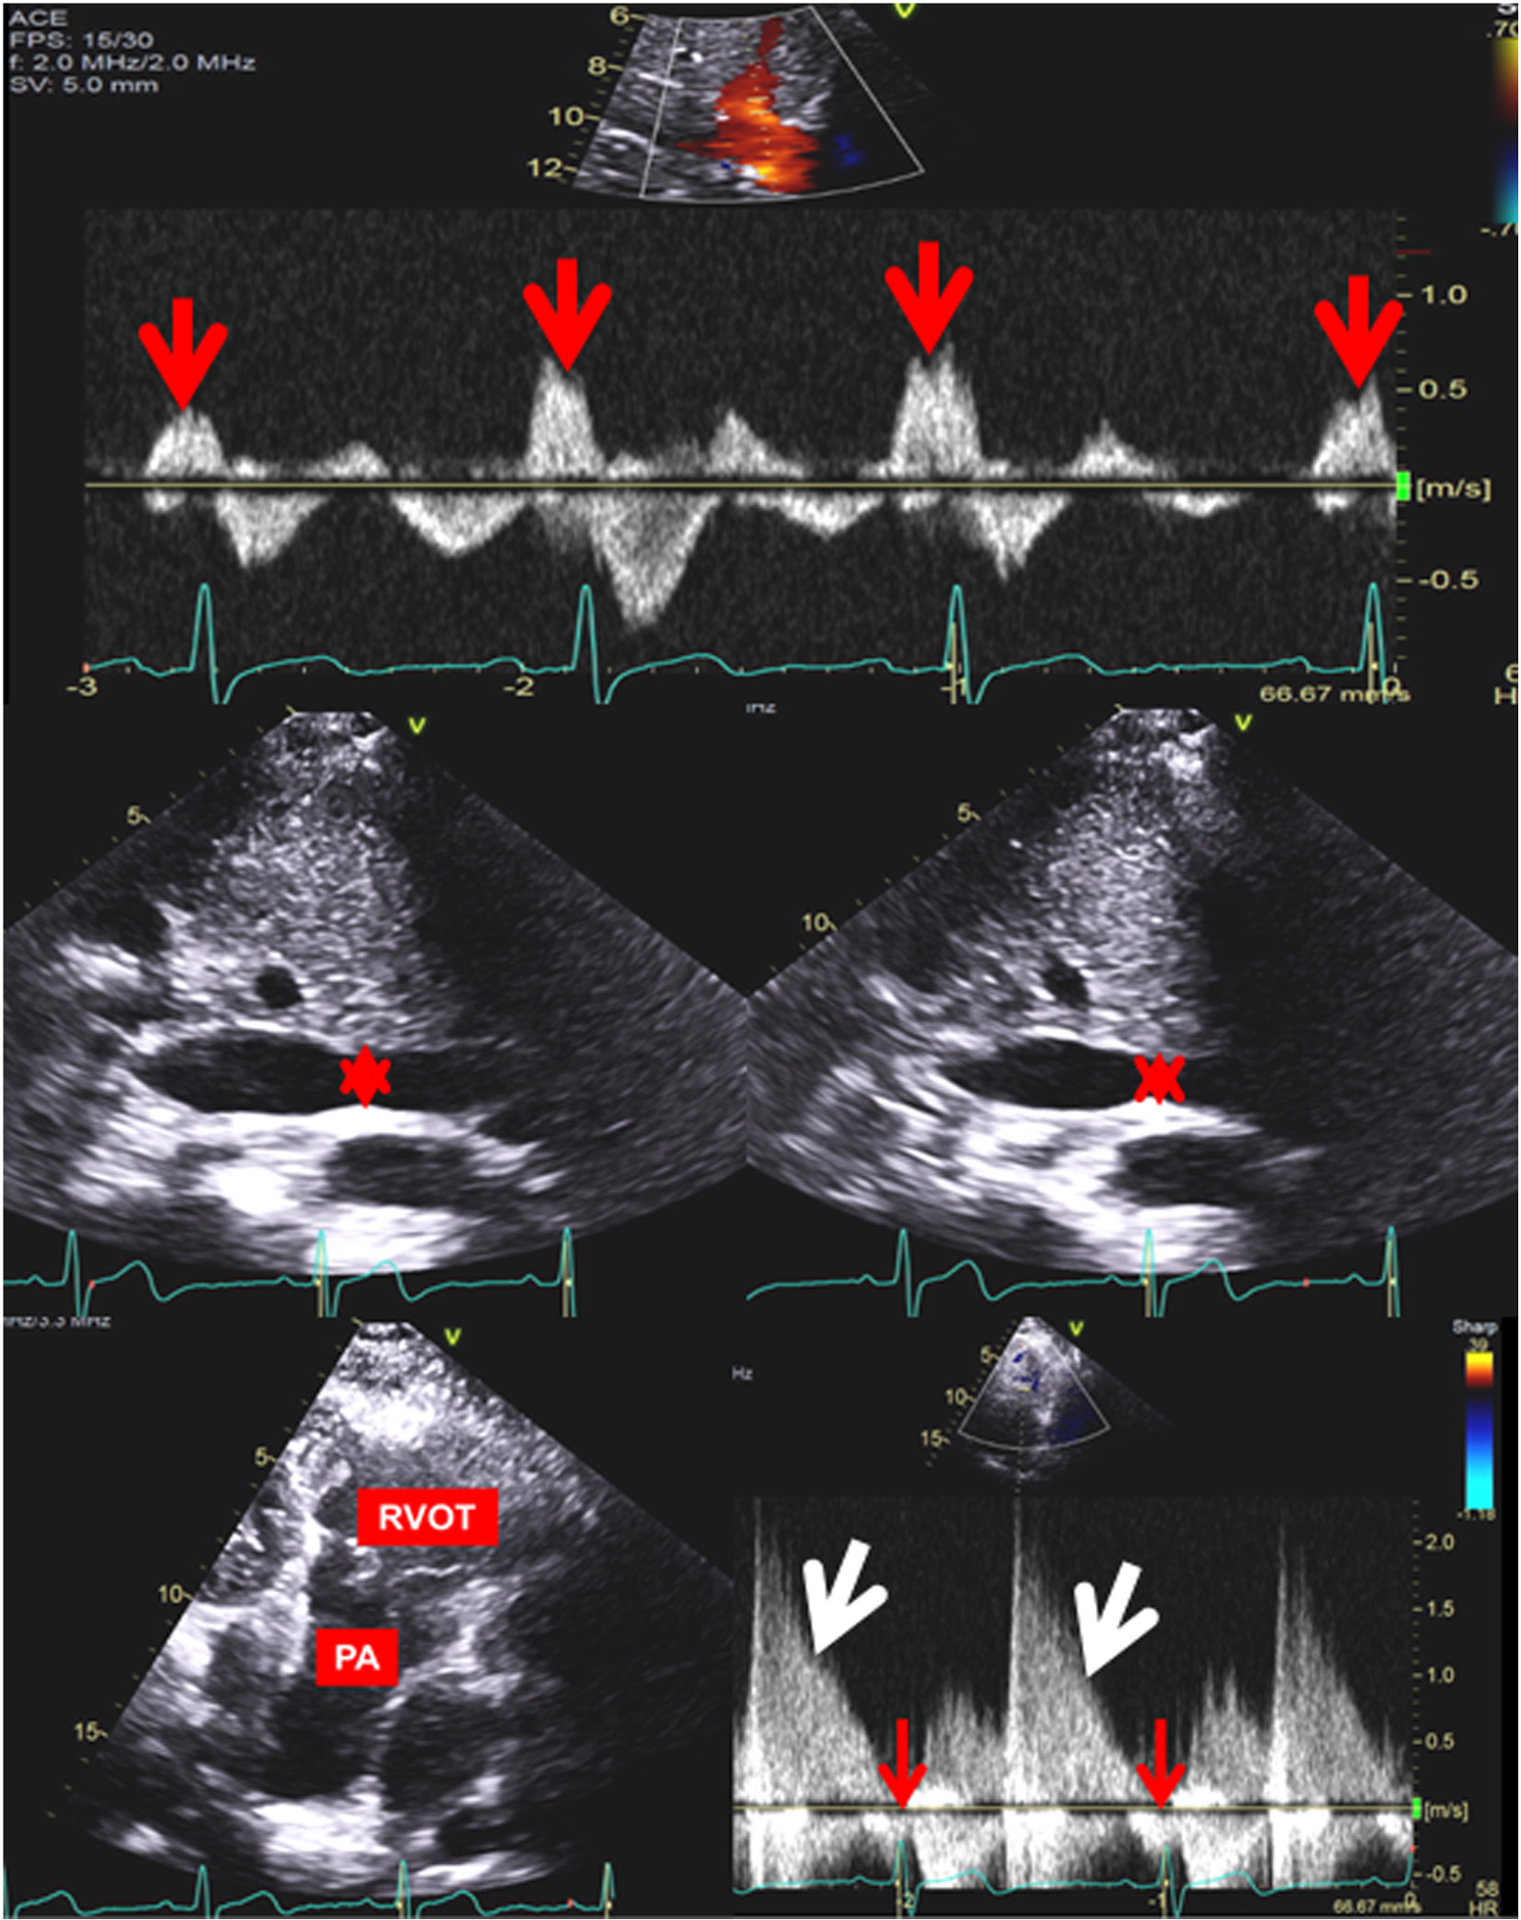
Fig. 1.

Top: Hepatic vein pulse wave Doppler showing diastolic flow reversal (red arrows) in 3 consecutive cardiac cycles Middle: Two-dimensional image of inferior vena cava showing measurements (red asterisk) at the largest dimension/inspiration on the left and at the smallest dimension/expiration on the right Bottom: Two-dimensional image of the right ventricular outflow tract (RVOT) and pulmonary artery (PA) on the left. Pulse wave Doppler of the main PA showing pulmonary regurgitation (white arrow) and late diastolic pulmonary artery forward flow (red arrow).
