
Figure 2.
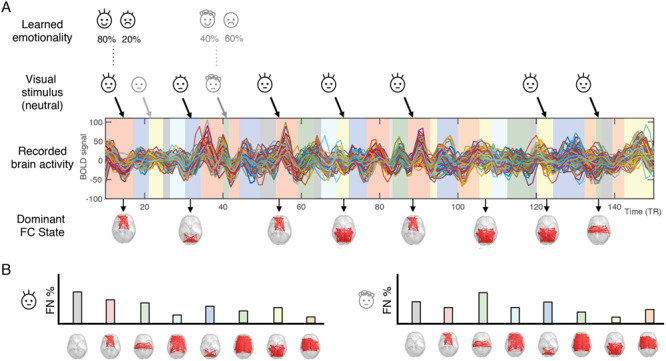
Schematic illustration of the LEiDA methodology used to analyze the fMRI data. (A) First, we applied LEiDA to the fMRI data and clustered the FC patterns into a given number, k, of FC states, assigning one of these FC state to each TR (represented by shaded colored bars under the BOLD signals). Then, for each infant face, we detect the FC state that is active 2TR after stimulus presentation (to account for the hemodynamic response time). (B) For each infant face and for each participant, we obtain a probability distribution of the FC states, which we subsequently correlate with the happy–sad gradient given by the probability of smiling in the training phase.