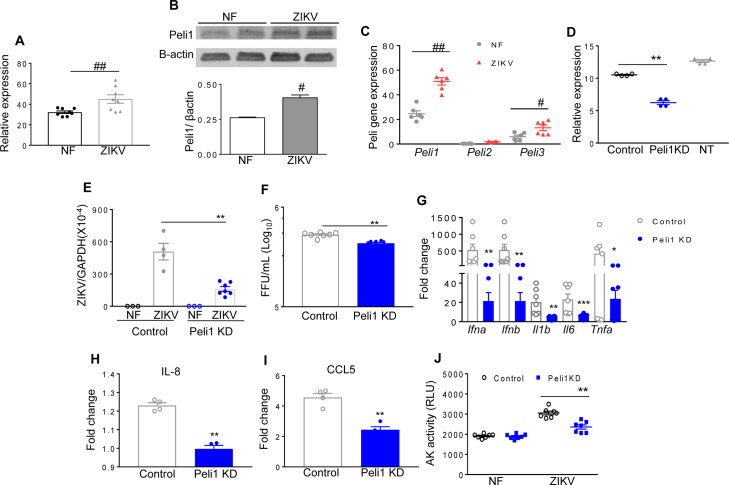
Fig 1. Peli1 expression in human monocytic cells, PBMCs and placental trophoblasts following ZIKV infection.
A. THP-1 cells were infected with ZIKV-FSS13025 at MOI of 1. RNA levels of Peli1 at day 4 were determined by qPCR assay. Data are presented as means ± SEM, n = 8. B. Western blot assays of Peli1 and β-actin expression on PBMCs of a healthy donor infected with ZIKV FSS13025 (MOI = 1) at day 3 pi. Top panel: Western blot image. Bottom panel: Image intensity was quantified using the Odyssey Infrared Imaging system and the ratios of Peli1/ β-actin are presented (n = 2). C. HTR8 cells were infected with ZIKV-FSS13025 at MOI of 1. RNA levels of Peli1-3 at day 6 were determined by qPCR assay. Data are presented as means ± SEM, n = 6. ## P < 0.01 or # P < 0.05 compared to non-infected (NF) group (Unpaired t test). D-J. HTR8 cells were treated with control or Peli1 siRNA (Peli1KD) or non-treated (NT), infected with ZIKV-FSS13025 at 24 h and harvested at day 4 post infection (pi). D. RNA levels of Peli1 were determined at 24 h post treatment by qPCR assay, n = 4. E-F. Viral load was measured at day 4 pi by qPCR and FFA. n = 3–7. G. Cytokine production was measured by qPCR at day 4 pi. n = 7–12. H-I. Chemokine levels were determined by Bioplex. J. Cell death was determined at day 4 pi by the activity of cell-associated adenylate kinase released in cell culture supernatants, n = 7. Data are presented as means ± SEM. ** P < 0.01 or *P < 0.05 compared to control group (Unpaired t test).

