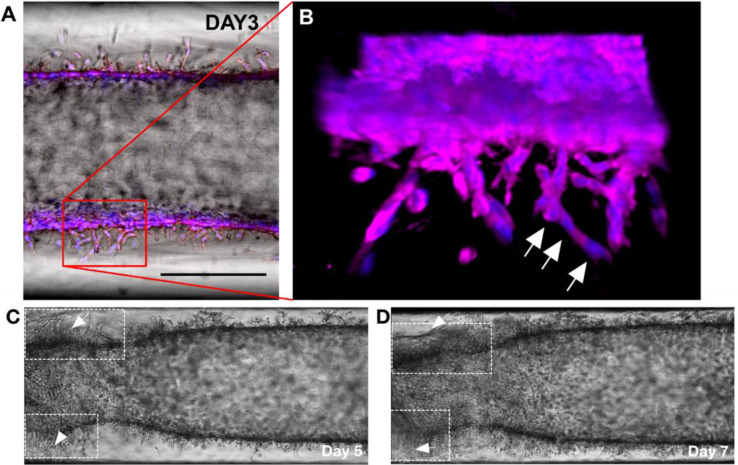
Fig 3. Invasion characteristics of SUM-159PT in IDC-on-chip.
(A) Bright field image of SUM-159PT cells in IDC-on-chip at day 3. Scale bar is 300 μm. (B) Confocal micrograph of SUM-159PT at day 3, cells showed characteristics of multicellular collective migration in the protrusion. Cell nuclei along a protrusion are noted with white arrows. Nuclei (blue) and plasma membrane (magenta). (C and D) The duct of SUM-159PT showed regions of matrix collapse, which are thought to be associated with matrix degradation (noted with arrows), it was observed from day 5 to day 7.

