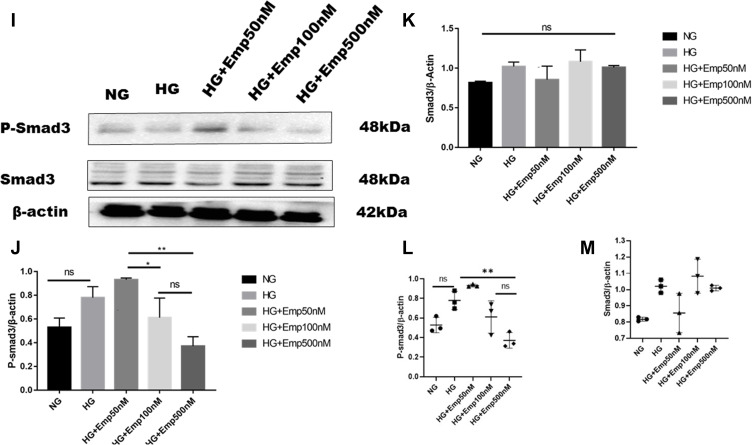
Figure 4.
Effect of Empagliflozin on the expression of proteins that affects fibrosis in HK-2 cell line. HK-2 cells were planted in 5.5mM glucose and 25mM glucose with or without empagliflozin treatment for 72 h. (A, F, L) Representative of Western blots illustrating fibronectin, TGF-β1, Col IV, P-smad3, Smad3, and β-actin protein expression in HK-2 cells. (B, C, G, J, K) Quantification of Western blot data in HK-2 cells. (D, E, H, L, M) Individual measurement represented as dot plot scatter. β-actin used as a loading control. The data represent the mean ± SD of three independent experiments. *P < 0.05, **P < 0.01, ***P < 0.001, ****P < 0.0001 vs. high glucose.
Abbreviation: ns, non-significant.

