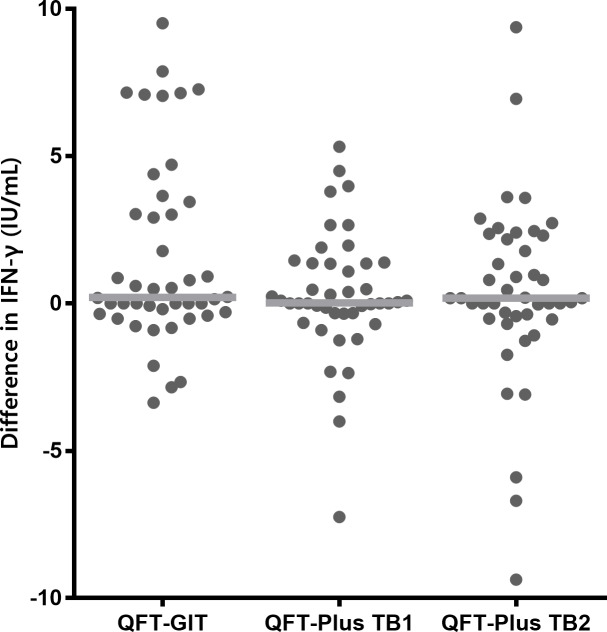
Fig 3. Differences in IFN-γ levels before and after preventive therapy.
The differences in IFN-γ concentrations before and after preventive therapy for each participant are shown (●). Median levels are indicated by gray lines. IFN-γ, interferon-γ; QFT-GIT, QuantiFERON-TB Gold In-Tube; QFT-Plus, QuantiFERON-TB Gold Plus.

