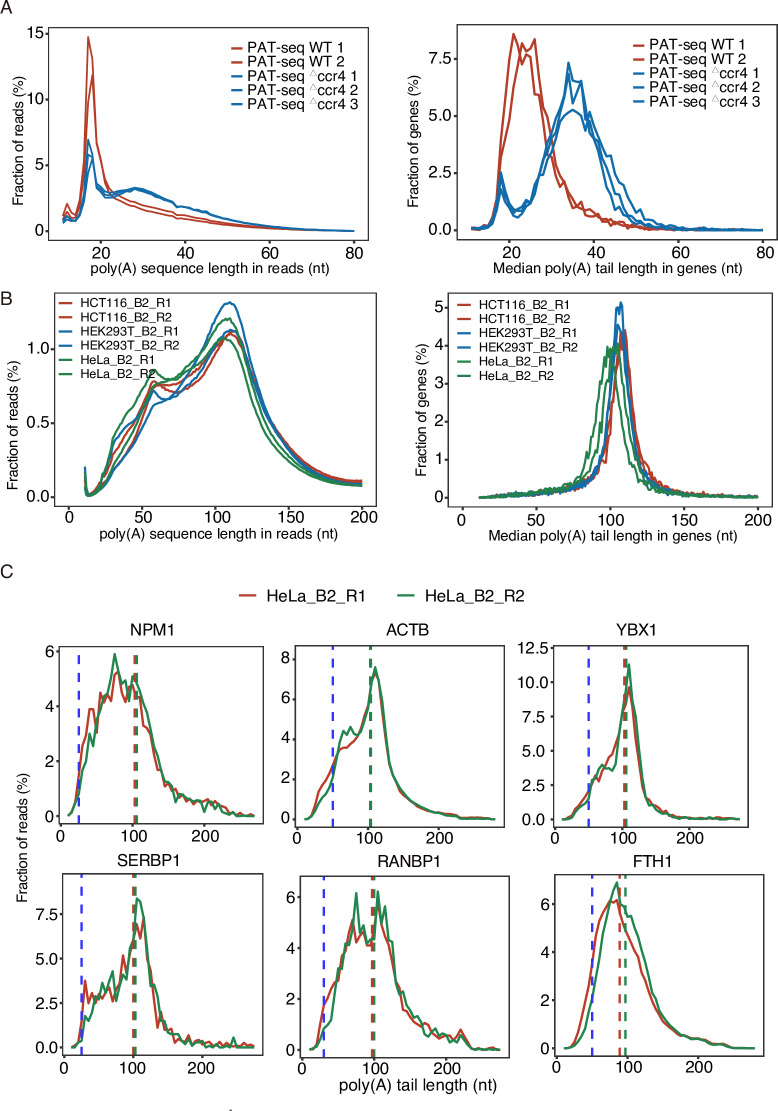
Fig 3. The length profiles of poly(A) sequence in Poly(A)-seq reads and of median poly(A) tails in genes.
A. The poly(A) tail length distribution in reads (left) and genes (right) in yeast, which is resulted from the analysis of PAT-seq data [21] by running pA-finder. B. The poly(A) tail length distribution in reads (left) and genes (right) in three human cell lines, which is resulted from the analysis of Poly(A)-seq data in this study by running pA-finder. C. Poly(A) tail profiles in poly(A)-containing reads of 6 human genes in HeLa cells. The blue dashed line indicates the poly(A) tail length detected by TAIL-seq [14]. The red and green dashed lines indicate the median poly(A) tail length of HeLa_B2_R1 and HeLa_B2_R2, respectively.

