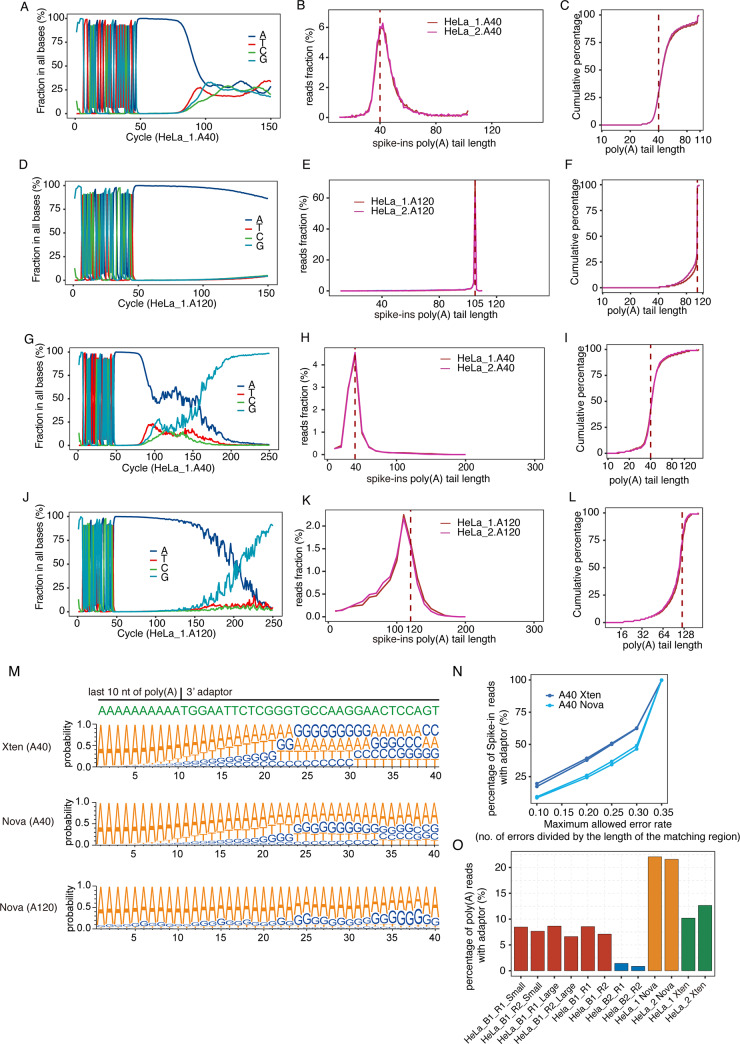
Fig 6. Application of Poly(A)-seq technology on HiSeq X-ten and Nova-seq 6000.
A. Distribution of four different sequenced bases in each of the 150 cycle of sequencing on HiSeq X Ten for the 80-nt spike-in RNA containing 40-nt poly(A) (A40). The spike-in in HeLa_1 is shown. B. Poly(A) tail profiles of the 40-nt poly(A) spike-in. C. A cumulative fraction displaying poly(A) tail length for 40-nt poly(A) spike-in. D. Distribution of four different sequenced bases in each of the 150 cycle of sequencing on HiSeq X Ten for the 160nt spike-in RNA containing 120-nt poly(A) (A120). The spike-in in HeLa_1 is shown. Please be noted that in the 150-nt end 1 reads, the maximal detection of the poly(A) sequence is 105-nt as detailed in the main text. E. Poly(A) tail profiles of the 120-nt poly(A) spike-in. F. A cumulative fraction displaying poly(A) tail length of 120-nt poly(A) spike-in. G-L. Similar to A-F but on NovaSeq 6000, respectively. M. Sequence probability of cycles corresponding to the last 10-nt of the poly(A) tail of each spike-in and the immediately followed 30-nt adaptor sequence. N. Percentage of the spike-in reads containing the detected adaptor sequence. The results from allowing different error rates varying from 0.1, 0.2, 0.25, 0.3 and 0.35 were plotted. O. Percentage of adaptor-detectable reads among the poly(A) tail reads obtained from HeLa cells in different bench of experiments.

