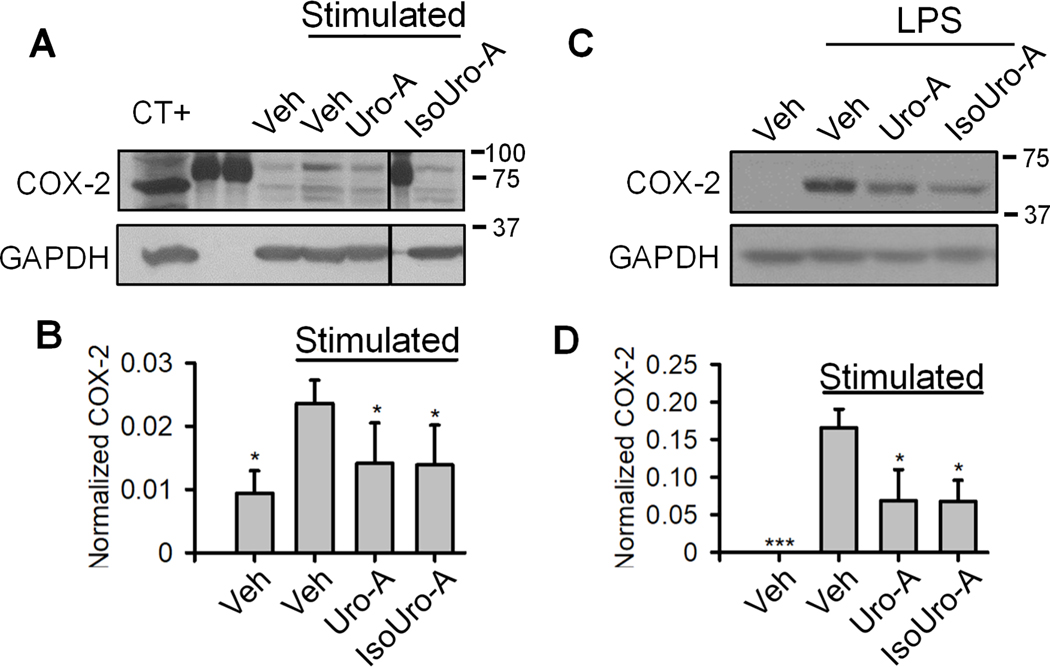
Figure 7.
Western blot analysis of COX-2 expression in stimulated human leukocytes (A) and murine RAW264.7 macrophages (C). The COX-2 expression levels in leukocytes (B) and macrophages (D) were quantified by densitometry analysis using ImageJ software. The lanes 2, 3, and 7 in (A) were loaded with protein molecular weight markers. The size of each marker (kDa) is given at the right of the figure. Veh.: vehicle. CT+: cell lysate obtained from LPS-treated RAW264.7 cells used as positive control. The vertical line in (A) indicates non-consecutive lanes in the same membrane. The experiment was performed using leukocytes from 6 volunteers. In RAW264.7 cells, the assay was repeated 3 times. *p<0.05 compared to the stimulated/veh.-treated group.

