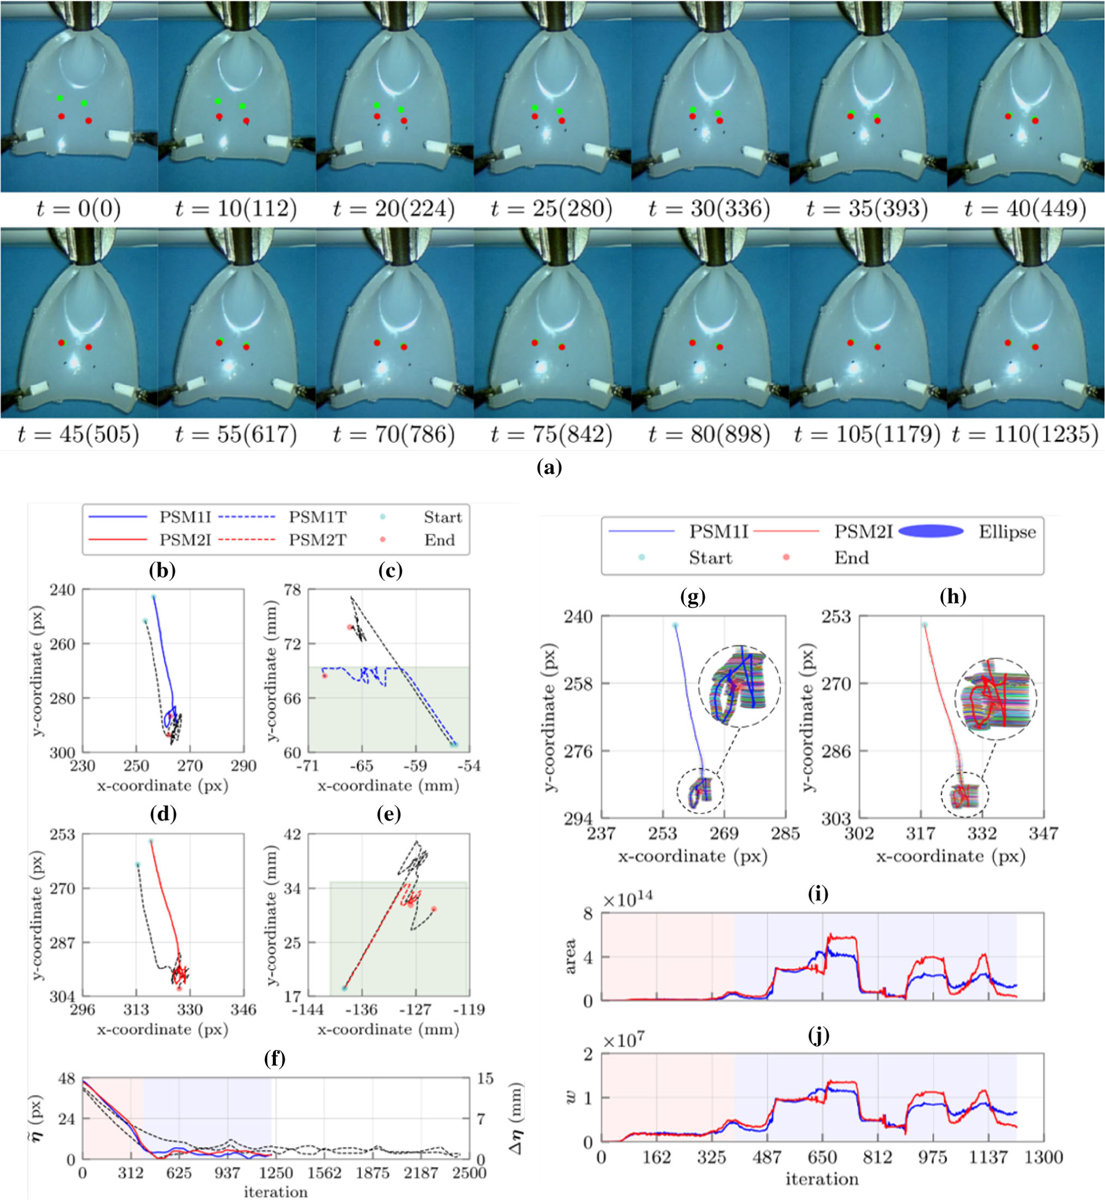
FIGURE 4.

(a) Sequence of snapshots with their corresponding time in second and iteration number during the constrained manipulation experiment with two target points. The green and red points represent the target points on the tissue and the desired probe insertion locations in the workspace, respectively; the left (b) and right (d) feature points (target locations) trajectories in the image plane, the left (c) and right (e) robots end effectors trajectories in the robot’s frame; (f) the Euclidean distance errors between the target locations and their corresponding desired cryoprobes insertion locations. The black dashed lines demonstrate the trajectories and error of the corresponding constraint free experiment; the manipulability ellipses along the left (g) and right (h) target locations trajectories in the image plane, (i) the areas of the manipulability ellipses for the left (blue) and right (red) target locations in each iteration, and (j) the Yoshikawa’s manipulability measure for the left (blue) and right (red) target locations in each iteration. Shaded regions represent the defined constraints (green) learning and identification (red) as well as the converging phases (blue), respectively.
