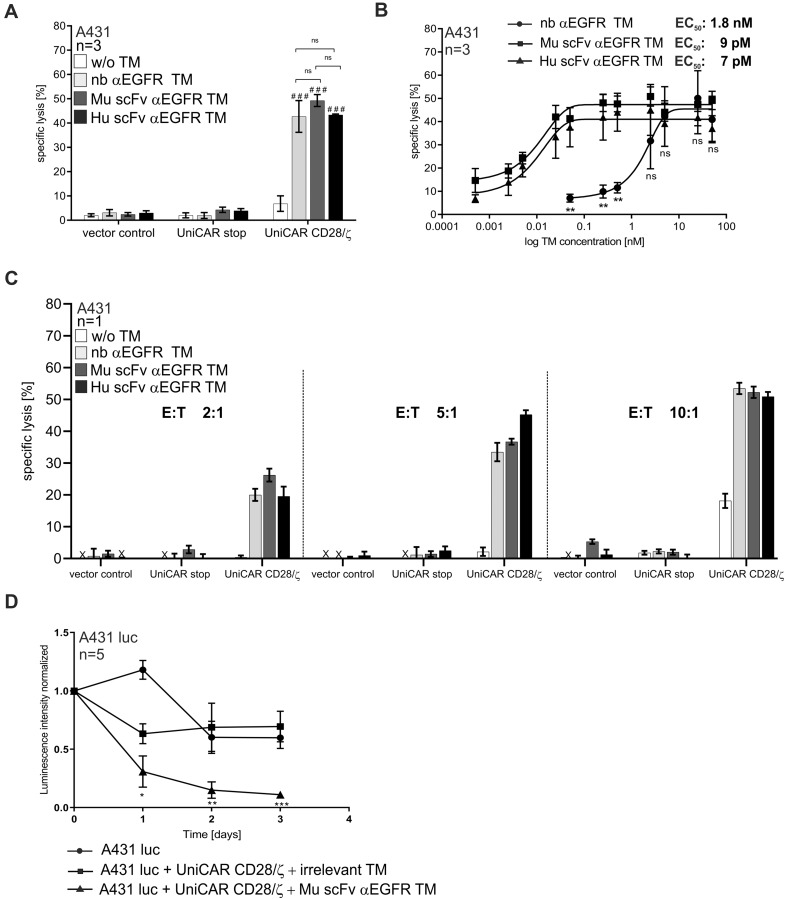
Figure 4.
Killing of A431 tumor cells by UniCAR T cells redirected by αEGFR TMs in vitro and in vivo. Chromium release cytotoxicity assays were performed to compare the functionality of the nb- and scFv-based αEGFR target modules (TMs) with respect to the redirection of UniCAR T cells towards EGFR-expressing A431 tumor cells. Therefore, 51Cr-loaded A431 cells were incubated for 24 h in the presence or absence of 50 nM of the respective TM together with UniCAR CD28/ζ T cells at an effector to target cell (E:T) ratio of 5:1 (A, B). Mock T cells expressing only EGFP (vector control) or UniCAR stop T cells lacking the intracellular signaling domain (UniCAR stop) served as controls. Bars represent the mean specific lysis with SEM of three individual donors (A). Using UniCAR CD28/ζ T cells under the same conditions with increasing concentrations of respective TMs, half-maximal effective concentration (EC50) values were estimated. Mean specific lysis with SEM of three individual donors for each concentration is shown (B). Additionally, indicated T cells were incubated with A431 tumor cells at different E:T ratios in the presence or absence of indicated TMs (C). Bars represent the mean specific lysis with SEM of triplicates for one representative donor (C). In vivo functionality of αEGFR TM was analyzed in a xenograft mouse model (D). Immunodeficient Rj:NMRI-Foxn1nu/nu mice were injected into the left flank with 1x10⁶ A431 luciferase-transduced tumor cells (A431 luc) alone or as a mixture with 1x10⁶ UniCAR CD28/ζ T cells in the presence of an irrelevant target module (TM) or the Mu scFv αEGFR TM resulting in three experimental groups with five animals per group. Tumor cell killing in anesthetized mice was investigated by bioluminescence imaging at indicated time points. Quantitative signal analysis was performed using Bruker Molecular Imaging software (Bruker, BioSpin Corporation) and presented as mean with SEM of each experimental group at indicated time points (D). Statistical significance was evaluated by two-way ANOVA (A) or one-way ANOVA (B, D) with Bonferroni’s multiple comparison test (###p < 0.001, ns (p ≥ 0.05) not significant with respect to control w/o TM or *p < 0.05, **p < 0.01, ***p < 0.001, ns (p ≥ 0.05) not significant between indicated TMs (A, B) or in comparison to the control group with irrelevant TM (D).

