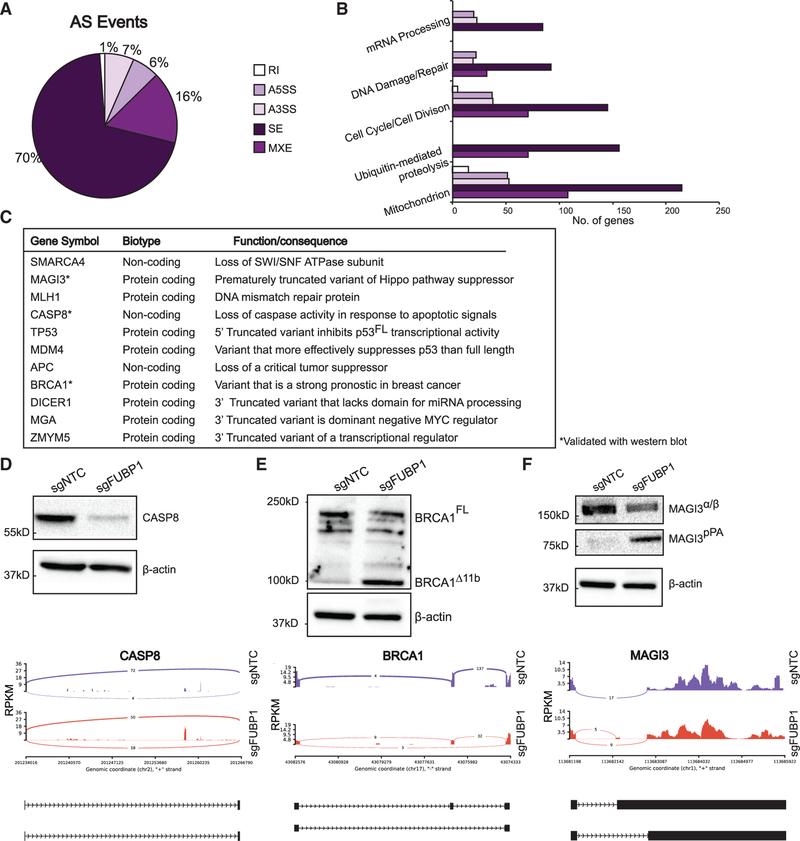
Figure 3. FUBP1 Promotes Alternative Splicing of Cancer Driver Genes.
(A) rMATS 4.0.1 used for detection of alternative splicing events in FUBP1-null cells. Pie chart shows distribution of A5′-splice site (A5SS), A3′-splice site (A3SS), skipped exon (SE), retained intron (RI), and mutually exclusive exon (MXE) splice events.
(B) Enrichment of functions of alternatively spliced genes detected by rMATS, performed by DAVID functional annotation analysis.
(C) Summary of cancer genes that are alternatively spliced in FUBP1-null cells, indicating gene name, biotype, and summary of function.
(D–F) Western blots of NTC and FUBP1-null cell lysates for CASP8 (D), BRCA1 (E), and MAGI3 (F) and corresponding sashimi plot of alternative splicing. Blot for BRCA1 was stripped and re-probed for MAGI3. In sashimi plots, y axis represents a modified reads per kilobase of transcript (RPKM), per a million mapped reads. Peaks report number of junction reads. Below each, cartoon representations of alternative isoforms: exons and introns are not drawn to scale and represented as black rectangles and lines, respectively.

