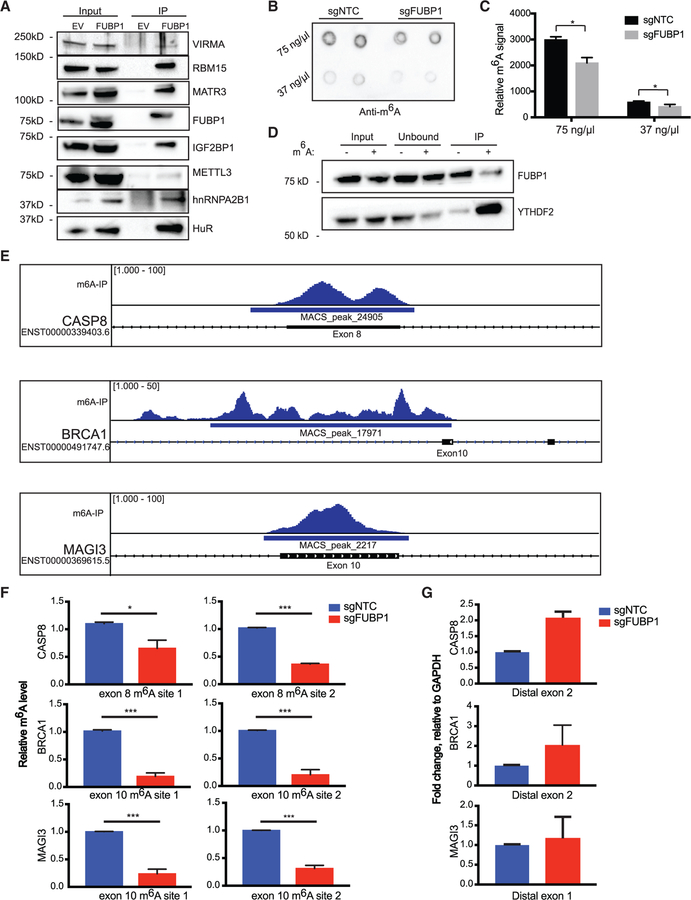
Figure 4. Exons Upstream of FUBP1-Regulated Splice Sites Exhibit Diminished m6A Levels in FUBP1-Null Cells.
(A) Western blot validation of significant proteins from IP/MS experiment.
(B and C) Dot blot measuring global m6A levels in mRNA of indicated cell lines (B), quantified in (C).
(D) RNA-IP with m6A-modified or non-modified RNA bait followed by immunoblotting for a bona fide m6A reader, YTHDF2, and FUBP1.
(E) Distribution of m6A-seq peaks across the CASP8, BRCA1, and MAGI3 loci, based on analysis of previously published m6A-seq data in HepG2 cells. The locations of the putative m6A sites are indicated within exons directly upstream of splice sites yielding AS transcripts found in FUBP1-null cells.
(F) Relative m6A levels at m6A consensus sites of CASP8, BRCA1, and MAGI3 in exons upstream of splice sites that yield alternative variants, determined by m6A RIP-qPCR in NTC and FUBP1-null MCF10F cells.
(G) CASP8, BRCA1, and MAGI3 mRNA levels relative to GAPDH determined by quantitative real-time PCR in NTC and FUBP1-null MCF10F cells (n = 2) using primers flanking the regions distal from splice sites, not surrounding m6A consensus sites. Data are presented as means ± SEM, n = 3 biological replicates per cell line. *p < 0.05 (two-tailed Student’s t tests), unless otherwise stated.

