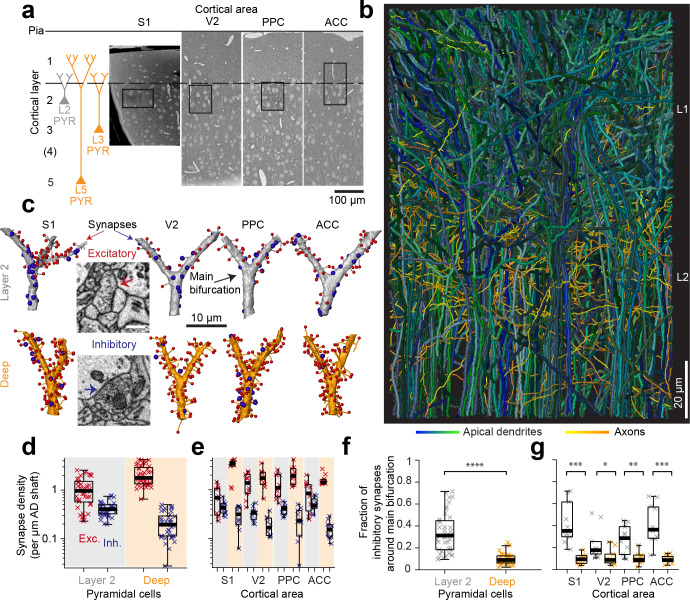
Figure 1. Complete synaptic input mapping of pyramidal cell apical dendrites (ADs) around their main bifurcation.
(a) Overview EM images indicating the location of 3D EM datasets in primary somatosensory (S1), secondary visual (V2), posterior parietal (PPC) and anterior cingulate (ACC) cortices relative to pia surface (solid line) and layer 1 / 2 border (dashed line). Schematic location of layer 2 (gray) and deep layer (orange) pyramidal neurons. (b) Reconstruction of all ADs contained in the ACC dataset (blue-green, n = 61 layer 2 and n = 152 deep layer ADs, respectively) and a subset of axons innervating them (n = 62, yellow-orange). Note that 80–90% of all pyramidal cells in cortex extend their apical dendrites into the L1/2 border region, allowing for massive synaptic convergence (https://wklink.org/8300). (c) Complete synaptic input maps of apical dendrite main bifurcations for deep layer (orange, S1: https://wklink.org/5413, V2: https://wklink.org/6059, PPC: https://wklink.org/9261, ACC: https://wklink.org/8408) and layer 2 (gray, S1: https://wklink.org/4049, V2: https://wklink.org/8965, PPC: https://wklink.org/8307, ACC: https://wklink.org/8695) pyramidal cells (example excitatory (spine, red spheres, https://wklink.org/9524) and putative inhibitory (shaft, blue spheres, https://wklink.org/2603) synapses, inset). (d) Box plot of putative inhibitory (blue crosses) and excitatory (red crosses) synapse densities per µm of AD shaft path length for L2 (n = 41, left) and DL ADs (n = 41, right) in S1, V2, PPC and ACC datasets. Wilcoxon rank-sum test, p < 10−6, 10−7 for excitatory and putative inhibitory densities, respectively. (e) Same as (d) reported separately per cortical region (n = 20 for S1, V2 and PPC, n = 22 for ACC). (f) Box plot of fraction of putative inhibitory synapses at the main bifurcation of deep (orange) and layer 2 (gray) ADs; individual ADs shown (crosses). (g) As (f) reported separately per cortical region. Asterisks indicate significance level of the Wilcoxon rank-sum test (*p < 0.05, **p < 0.01, ***p < 10−3, ****p < 10−4). Scale bars: 0.5 µm (inset in c).


