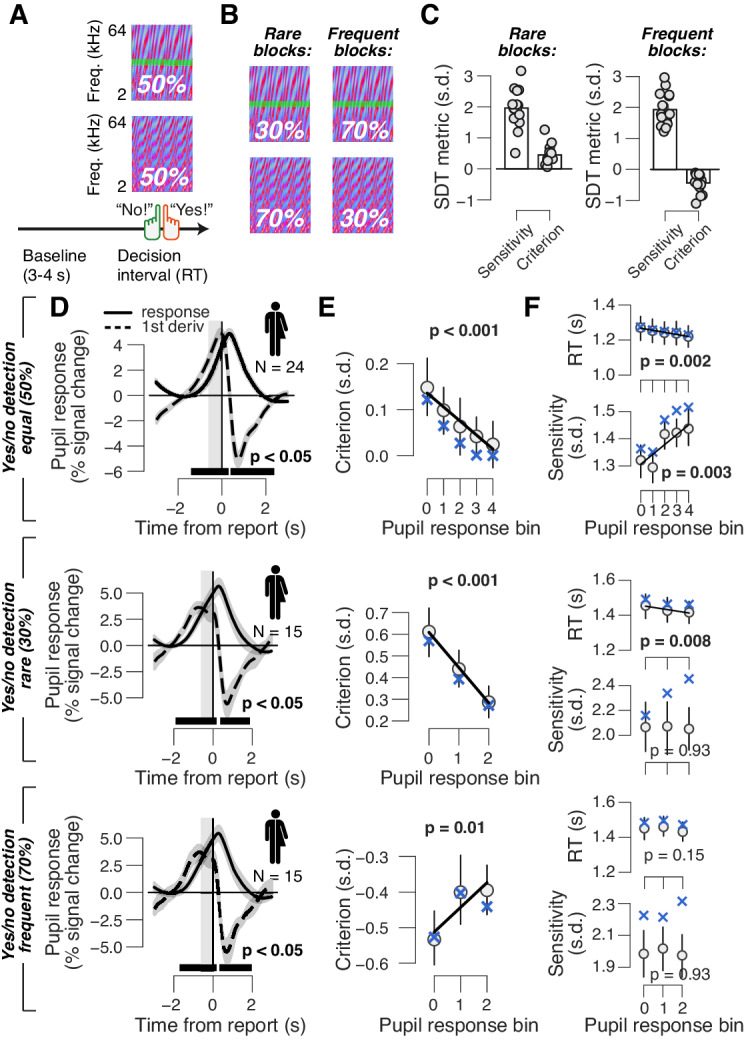
Figure 2. Phasic arousal reduces both conservative and liberal choice biases.
(A) Auditory yes/no (forced choice) tone-in-noise detection task. Schematic sequence of events during a trial. Subjects reported the presence or absence of a faint signal (pure tone; green band) embedded in noise (see 'Materials and methods'). (B) A separate batch of subjects performed the same task, but the signal now occurred in 30% of trials (‘rare’ condition) or in 70% trials (‘frequent’ condition). (C) Overall sensitivity and bias in rare and frequent conditions. (D) Task-evoked pupil response (solid line) and its derivative (dashed) in the equal (top), rare (middle) and frequent (bottom) signal occurrence conditions. Gray window, interval for extracting task-evoked pupil response measures; black bar, significant pupil derivative (p<0.05, cluster-corrected one-sample t-test). (E) Relationship between pupil response and choice bias in the equal (top), rare (middle) and frequent (bottom) signal occurrence conditions. For the biased signal occurrence conditions, we used three pupil-defined bins because there were fewer trials per individual (less than 500) than in the previous data sets (more than 500; see 'Materials and methods'). (F) As panel (E), but for mean RT and perceptual sensitivity. (D–F) Group average (N = 24; N = 15; N = 15); shading or error bars = s.e.m. Solid lines show linear or quadratic fits to binned data (linear fits are shown where first-order fit was superior to constant fit; quadratic fits are shown where second-order fit was superior to first-order fit). Blue ‘X’s, predictions from the ‘full’ drift diffusion model (see Figure 4 and associated text); p-values, mixed linear modeling.


