
Figure 5.
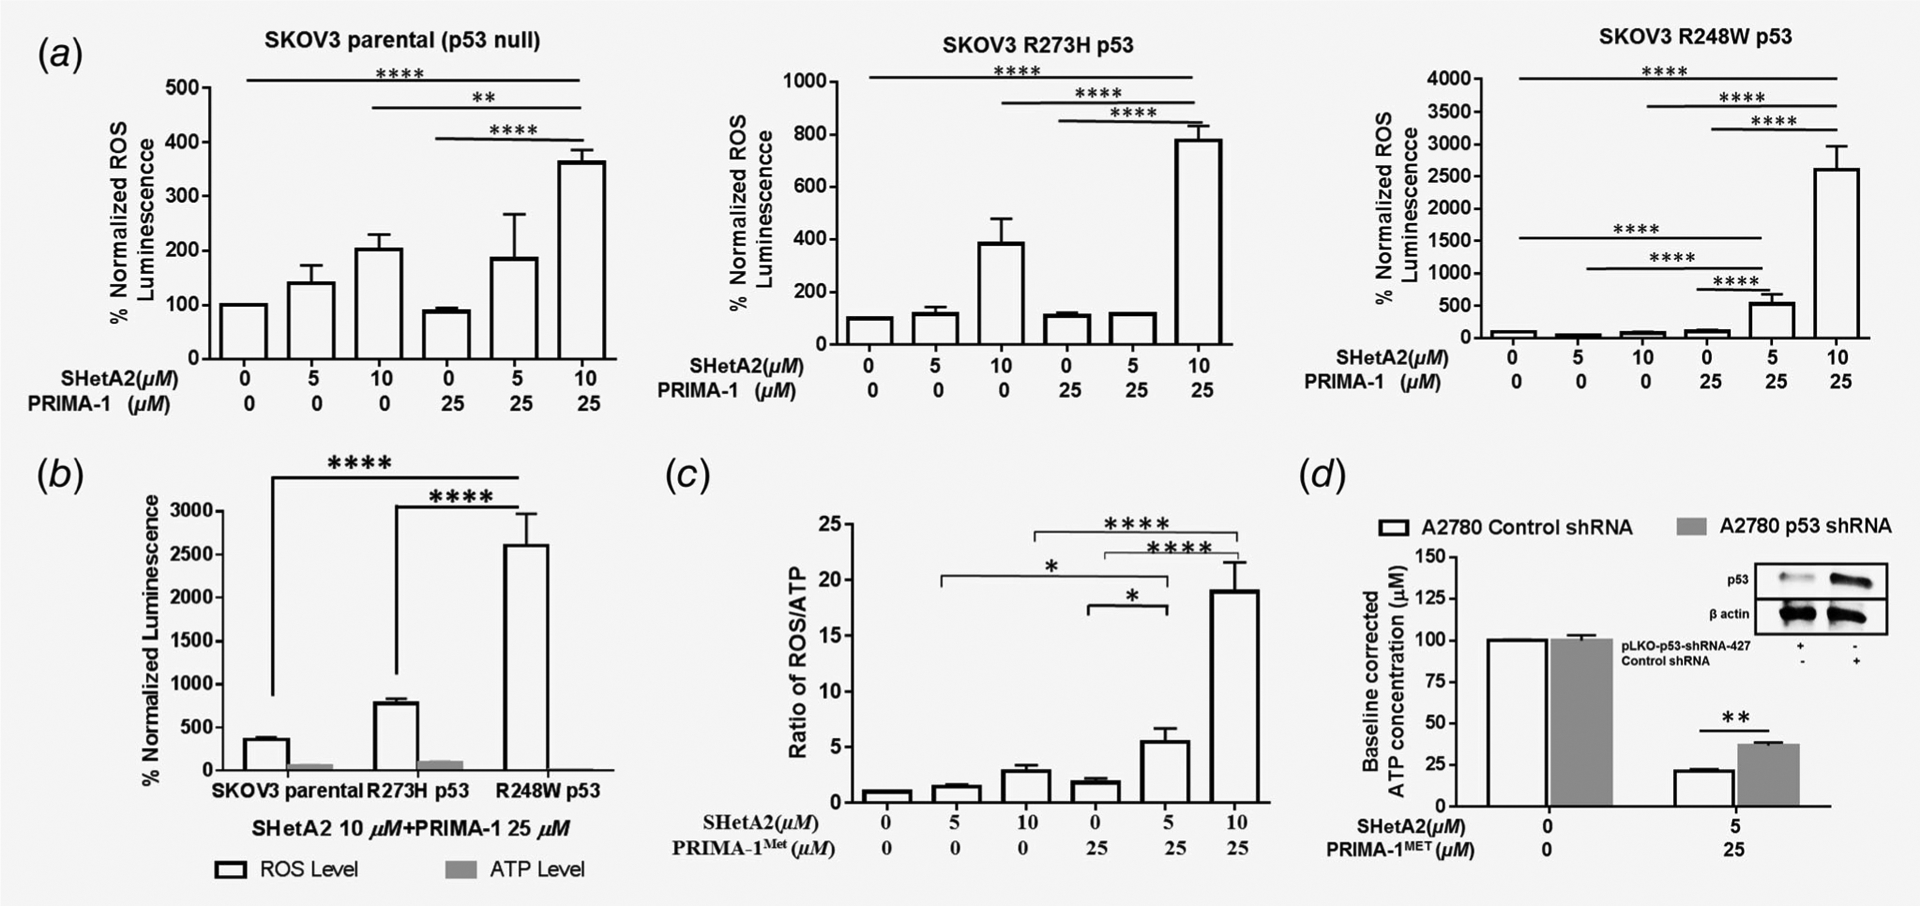
Evaluation of ROS and ATP in the mechanism of SHetA2 and PRIMA-1/PRIMA-1MET synergy. (a) Induction of ROS in SKOV3 parental, SKOV3 R273H p53 and SKOV3 R248W p53 cells after treatment with SHetA2 or PRIMA-1 alone or in combinations **p ≤ 0.01, ***p ≤ 0.001 ****p ≤ 0.0001. (b) ROS and ATP levels in the SKOV3 parental and SKOV3 R248W p53, R73H p53 cells after treatment with drug combination. ****p < 0.0001. (c) Ratio of ROS/ATP (each normalized to protein concentration). ANOVA with Tukey’s multiple comparison test: *p ≤ 0.05, **p ≤ 0.01, ****p ≤ 0.0001. (c) Ratio of ROS/ATP in A2780 cells after treatment with SHetA2 or PRIMA-1MET or both combined. (d) Change in ATP concentration in A2780 cells stably transfected with control shRNA or p53 shRNA after treatment with SHetA2 and PRIMA-1MET drug combination.