
Fig 2. Ethanol-derived hepatic extracellular vesicles stimulate IL-1β production in Kupffer cells.
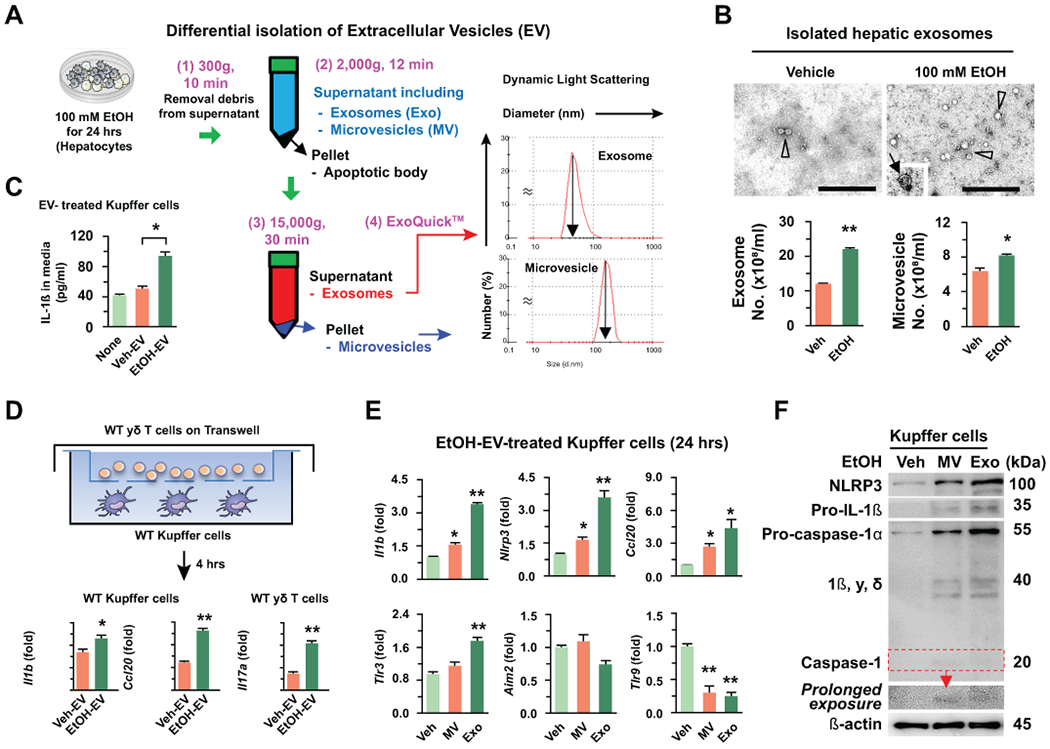
(A) Differential isolation of hepatic extracellular vesicles (EV). Microvesicles (MV) and exosomes (Exo) were collected by step-wise centrifugation and ExoQuick-TC™. Each size was analyzed by dynamic light scattering. (B) Shapes and numbers of MV (arrow in an insert) and Exo (arrow head) were assessed by electron microscope and nanoparticle tracking analysis. Bar = 500 nm. (C) Freshly isolated hepatocytes were treated with or without 100 mM EtOH for 24 hours. Next, the IL-1β concentration was measured in the media after treatments of Kupffer cells with vehicle-induced EV (Veh-EV) and ethanol-induced EV (EtOH-EV) for 24 hours. (D) Schematic diagram of the co-culturing system using Transwell with 3 μm pore. After pretreatment of WT Kupffer cells with Veh- or EtOH-Exo for 12 hours, the media were changed and then they were co-cultured with WT γδ T cells for an additional 4 hours. Kupffer cells and migrated γδ T cells were subjected to qRT-PCR. (E, F) After treatments of Kupffer cells with vehicle (medium), EtOH-induced MV and Exo, the expression changes of genes and proteins were analyzed by qRT-PCR and immunoblotting, respectively. Values and images represent the results from three experimental replicates. Data are expressed as the mean ± SEM. *P < 0.05, **P < 0.01 compared to the corresponding control, based on unpaired t-test between two groups and one way ANOVA with Dunnett’s test for multiple comparison vs control.