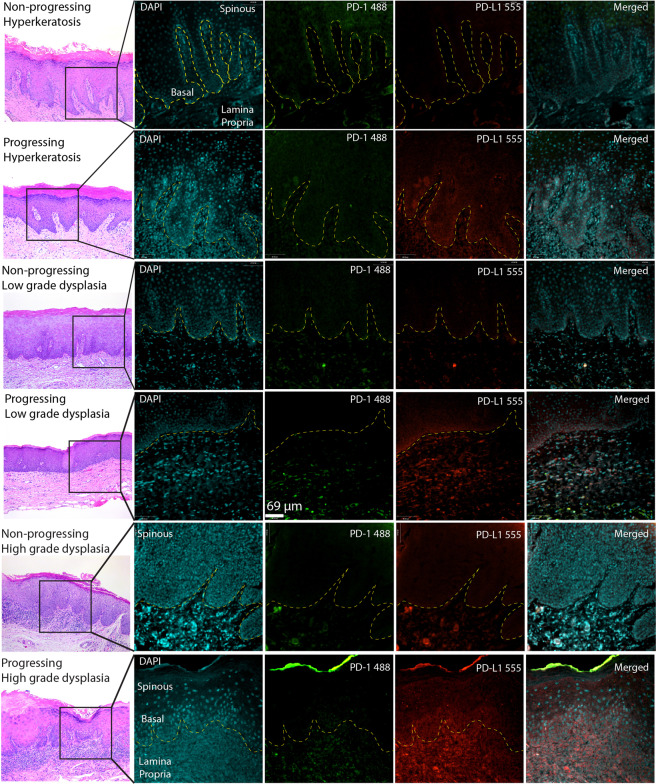
Figure 3.
Representative images of non-progressing and progressing lesions of hyperkeratosis, mild and severe dysplasia. The samples were stained using conventional H&E and FIHC and imaged using a spinning disk confocal microscope (see Materials and methods). The right panels show the expression of PD-1 and PD-L1 and the segmented areas used to calculate expression as Area × MFI. Images are representative of 10 images from each sample and a total 10 HK, 9 LGD, 10 HGD and 10 samples of OSCC.

