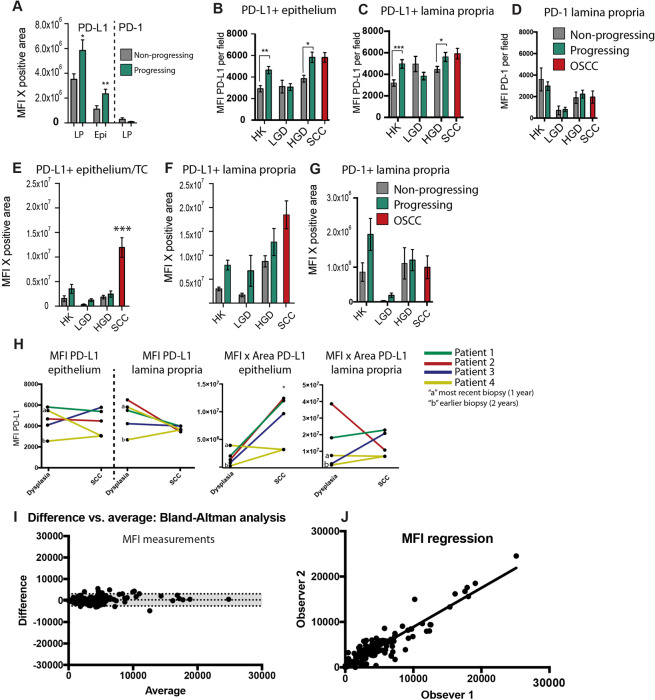
Figure 4.
Quantification of PD-1 and PD-L1 in FIHC images. (A) Expression of PD-1+ at the lamina propria (LP) and PD-L1 + (LP and epithelium) calculated as MFI × area in progressing (green bars) versus control (grey bars) (*P < 0.05, ** P < 0.01). MFI of PD-L1 was calculated at the epithelium (B) and lamina propria (C) and PD-1 at the lamina propria (D). Expression of PD-L1 was calculated as the product of MFI and average positive area at the epithelium (E) and lamina propria (F) and PD-1 at the lamina propria (G). A total of 5 images per sample were analyzed, and the average of the results is shown in the bar graph - progressing (green bars) versus control (grey bars)(*P < 0.05, ** P < 0.01). (H) Differences in expression of PD-L1 (MFI × Area) between matched premalignant and OSCC patients. One case has 2 previous biopsies and “a” represents the most recent biopsy (1 year) and “b” represents the earlier biopsy (2 year). There are no significant differences between the groups (paired t-tests between OSCC and premalignant cases, P > 0.4) (I) Bland-Altman analysis, difference versus average, between two examiners (bias of 289 ± 1446 and a 95% limit of the agreement between −2546 and +3124). (J) Linear regression of the scores of the two examiners (slope of 0.8615 ± 0.02436 and R2 = 0.8742).

